Why are law school graduates still failing the bar exam at a high rate?

The first decline took place in the July 2014 bar exam, which some believed might be blamed on an ExamSoft software glitch. Then came continued declines in the July 2015 exam, which some blamed on the addition of Civil Procedure to the Multistate Bar Exam. The declines persisted and even worsened.

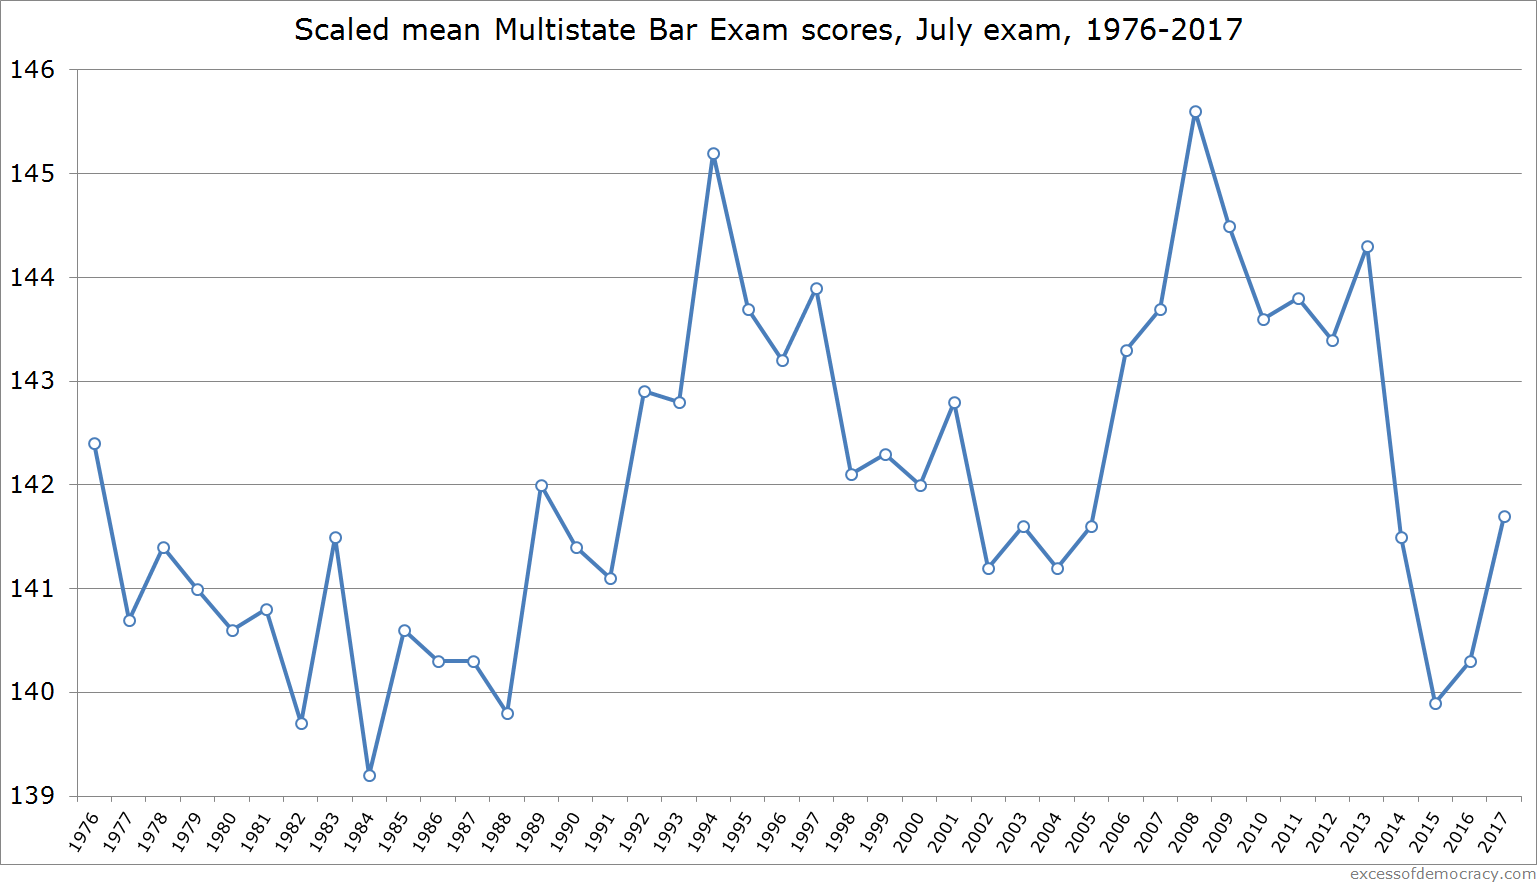
Five straight July bar exam cycles with persistent low pass rates across the country. But the bar exam has not become more difficult. Why?

One reason rates remain low is that predictors for incoming classes remain low. LSAT scores actually declined among the most at-risk students between the incoming classes admitted in the 2011-2012 cycle (graduating in 2015) and the 2014-2015 cycle (graduating in 2018). The 25th percentile median LSAT among full-time entrants dropped 2 LSAT points between those who graduated in the Class of 2015 and the Class of 2018. Indeed, 11 schools saw a drop of at least 5 LSAT points in their 25th percentile incoming classes—almost as many as those that saw any improvement whatsoever (just 12 schools, including Yale and Stanford).

Not all LSAT declines are created equal: a drop from 170 to 168 is much more marginal than a drop from 152 to 150; and a drop can have a bigger impact depending on the cut score of the bar exam in each jurisdiction. But it’s no surprise, then, to see the persistently low, and even declining, bar passage rates around the country with this quick aggregate analysis.

Nevertheless, since around September 2014, law schools have been acutely aware of the problem of declining bar passage rates. Perhaps it was too late to course-correct on admissions cycles through at least the Class of 2017.

But what about academic advising? What about providing bar preparation services for at-risk students? Given that law schools have been on notice for nearly five years, why haven’t bar passage rates improved?

I confess, I don’t know what’s happened. But I have a few ideas that I think are worth exploring.

First, it seems increasingly likely that academic dismissal rates, while rising slightly over several years, have not kept pace to account for the significant decline in quality of entering students. Of course, academic dismissals are only one part of the picture, and a controversial topic at that, particularly if tethered to projections about future likelihood to pass the bar exam on the first attempt. I won’t delve into those challenging discussions; I simply note them here.

Another is that law schools haven’t provided those academic advising or bar preparation services to students—but that seems unlikely.

Still another, and perhaps much more alarming, concern is that those bar services have been ineffective (or not as effective as one might hope). And this is a moment of reckoning for law schools.

Assuredly, when the first downturns of scores came, law schools felt they had to do something, anything, to right the ship. That meant taking steps that would calm the fears of law students and appease universities. Creating or expanding bar preparation courses, or hiring individuals dedicated with bar preparation, would be easy solutions—law students could participate in direct and tangible courses that were specifically designed to help them achieve bar exam success; law faculty could feel relieved that steps were being taken to help students; university administrators could feel confident that something was being done. Whether these bolstered existing courses or added to them, assuredly schools provided opportunities to their students.

But… to what end? Something was done at many institutions. Has it been effective?

Apparently not. The lagging (and falling) bar passage rates are a sign of that. Granted, perhaps the slide would be worse without such courses, but that seems like cold comfort to schools that have been trying to affirmatively improve rates.

We now have the first evidence to that effect. A report commissioned by the California State Bar recently studied several California law schools that disclosed student-specific data on a wide range of fronts—not just LSAT and UGPA in relation to their bar exam score, but law school GPA, courses taken, even participation in externships and clinic.

One variable to consider was involvement in a bar preparation course. Did participation in a bar preparation course help students pass the bar? I excerpt the unsettling finding here:

Five law schools provided data for this variable. Students averaged about 1.5 units (range 0 to 6). For all those students, there was a -.20 (p<.0001) correlation between the number of units taken and CBX TOTSCL [California Bar Exam Total Scale Scores]. The source of this negative relationship appears to be the fact that in five out of six [sic] of the schools, it was students with lower GPAs who took these classes. After controlling for GPA, the number of bar preparation course units a student takes had no relationship to their performance on the CBX. A follow up analysis, examining just the students in the lower half of GPA distribution, showed that there was no statistically significant difference in CBX TOTSCL for those who took a bar preparation course versus those who did not (p=.24). Analyses conducted within each of the five schools yielded similar findings.

This should be a red flag for law schools seeking to provide bar preparation services to their students. In this student, whatever law schools are doing to help their students pass the bar has no discernible impact on students’ actual bar exam scores.

Granted, these are just five California law schools and the California bar. And there has been other school-specific programs at some institutions that may provide a better model.

But it’s worth law schools considering whether students are on a path toward improving bar passage success or simply on a hamster wheel of doing more work without any discernible positive impact. More studies and evidence are of course in order. But the results from the last several years, confirmed by the study of five California law schools, suggests that revisiting the existing the model is of some urgency.

MBE scores drop to 34-year low as bar pass rates decline again

On the heels of some good news in recent administrations of the July bar exam comes tough news from the National Conference of Bar Examiners: the Multistate Bar Exam (MBE) scores have dropped to a 34-year low, their lowest point since 1984.

For perspective, California's "cut score" is 144, Virginia 140, Texas 135, New York 133. A bar score of 139.5 is comparable to 2015 (139.9) in recent years. One would have to go back to the 80s to see comparable scores: 1982 (139.7), 1984 (139.2), & 1988 (139.8).

I’d hoped that perhaps qualifications of students have rebounded a bit as schools improved their incoming classes a few years ago; perhaps students are putting more effort into the bar than previous years; or other factors. That appears to not be the case this year.

That said, MBE scores may be slightly less predictive of what will happen with actual bar pass rates. the NCBE has pointed out that the rise of the Uniform Bar Exam has led to a number of test-takers transferring scores to new jurisdictions rather than taking a second jurisdiction’s bar—and, presumably, those who pass in one jurisdiction are much more likely to pass in another jurisdiction (accepting that cut scores can vary in some jurisdictions). The UBE points to a few thousand such transfers last year, at least some of whom may have taken the bar exam. But put against more than 40,000 MBE test-takers, the effect, while real, may be small.

Instead, we’re left to watch as results come in state by state. Tracking first-time pass rates (from jurisdictions that share them so far—ideally, ABA graduates would be a better measure, but this works reasonably well for now), declines have been pretty consistent: New Mexico (-14 points), Indiana (-3), North Carolina (+1), Oklahoma (-8), Missouri (-7), Iowa (-3), Washington (-3), and Florida (-4). But in many of these jurisdiction, pass rates were worse in, say, 2015 or 2016.

We’ll know more in the months to come, but it looks like another year of decline will cause some continued anguish in legal education. The increased quality of law school applicants this year will help the July 2021 bar exam look much better.

Note: I chose a non-zero Y-axis to show relative performance.

February 2018 MBE bar scores collapse to all-time record low in test history

If that headline seems like déjà vu, it's because I wrote the same headline after the February 2017 MBE bar scores were released. There were some interesting comments last year about the best way to visualize the decline, so here are a couple of attempts below. (You can see more about the methodology choices in last year's post, including reasons it's a non-zero Y-axis, which would be absurd.)

We now know the mean scaled national February MBE score was 132.8, down 1.8 points from last year's 134.0, which was already an all-time record low. We would expect bar exam passing rates to drop in most jurisdictions.

For perspective, California's "cut score" is 144, Virginia's 140, Texas's 135, and New York's 133. The trend is more pronounced when looking at a more recent window of scores.

On the heels of an uptick in MBE scores last July, the results are particularly troubling. Given how small the February pool is in relation to the July pool, it's hard to draw too many conclusions from the February test-taker pool.

That said, the February cohort is historically much weaker than the July cohort, in part because it includes so many who failed in July and retook in February. Without knowing the percentage of repeaters, that would be the first place to look.

Another reason might relate to the increase in the July scores. Based on some informed speculation, some schools may have been advising some more at-risk students to delay taking the July exam and instead prepare more for the February exam in hopes of increasing first-time pass rates. If that happened, we may see a skewing in the quality of first-time test-takers in the February cohort, which would result in a decline in scores. That might explain some of the small improvement in July and decline in February.

At some point soon, however, we should see a more regular rebound in bar pass rates. The first major drop in bar exam scores was revealed to law schools in late fall 2014. That means the 2014-2015 applicant cycle, to the extent schools took heed of the warning, was a time for them to improve the quality of their incoming classes, leading to some improvement for the class graduating this May of 2018.

Of course, these are high-level projections and guesses. School-specific data would be useful. But it surely will not end the debates raging right now about the bar exam, and it will only serve to put more pressure on law schools looking at this July's bar exam.

UPDATE: NCBEX has revealed that first-time test-takers were 30% of the pool and saw a smaller decline than repeaters, but the number of repeaters was mostly unchanged. Karen Sloan has more.

A change in calculating pass rates for the California bar exam

Good news from the California bar: the overall bar pass rate rose year-over-year from 43% to 49.6%. Or... did it?

The State Bar of California made a small change to how it calculates the passing rate of bar exam test-takers. In April 2017, it adopted the following change:

It was moved, seconded and duly carried that beginning with the February 2017 administration of the California Bar Examination applicants who did not complete all portions of the examination not be included in the pass/fail statistics published at the time results from the examination are published; and that for an examination to be considered complete, applicant must have achieved a grade of at least 40 on their answers to each question on the examination.

The change is a sensible one: if a test-taker walks out in the middle of the exam, it doesn't seem terribly sensible to include that test-taker as a failure. That's not usually what we'd think about in terms of failure rates; instead, those who sat through the whole exam, answered all the questions, and tried to pass the bar would be the ones whose success rates we'd like to evaluate. A quotation from Karen Goodman on the Committee of Bar Examiners in the Daily Journal was consistent with this: "It seemed like if people did not finish the test, they should not count against the pass rate." (Of course, I suppose, the person did fail!)

At the same time, instituting this new change could make it appear that bar pass rates were higher than they actually were, because the new pass rates are going to be higher than old pass rates due to the change in methodology.

The February 2017 overall pass rate was reported at 34.5%, when under the old methodology it would have been 33.9% (a 0.6-point difference). 78 did not complete the exam

For July 2017, 66 did not complete the exam. That lifted the overall percentage who passed from 49.19% to 49.57%. A California bar representative also informed me that the July 2016 exam had 89 who did not complete the exam, a pass rate of 43.57% v. 43.07%.

(It's worth emphasizing this difference is probably even smaller today because the bar has been shorted from three days to two as of July 2017, making it more likely that more individuals will finish the exam.)

This is a very modest advantage to all schools in reporting their overall pass rates--odds are that one dropout in 200 can bump a school's overall score by a point (when rounded). And it offers a very modest (if slightly deceptive) improvement to the current state of affairs when considering bar passage rates in California. It makes comparisons across years slightly disparate.

But, in an era nearly obsessed with almost any numerical change in bar exam statistics, this one is worth highlighting for future consideration. The true year-over-year comparison is 43.6% to 49.6% (+6 points), or 43.1% [sic; that's the percentage shared with me!] to 49.2% (+6.2 points), not 43.0% to 49.6% (+6.6 points). In future years, the comparison will be easier to make.

Recent trends in non-JD legal education

I've blogged before about the rise of non-JD legal education. Law schools increasingly rely on non-JD sources of revenue (now, 1 in 9 students enrolled in a law school are not a part of the JD program, up sharply over the last few years). I've also expressed some concern about the value proposition of some of those degrees, particularly given the high failure rate of LLM graduates on the bar exam.

I thought I'd share a prediction, an update, and a new observation.

First, I predict that non-JD enrollment will drop this year, the first such decline in some time. I suggested last year that the new presidential administration might lead to declines in foreign visitors to American educational institutions. I anticipate that will be true when it comes to non-JD education (and foreign students are a significant portion of such degree offerings). Even though the "Travel Ban 1.0/2.0/3.0" has been ostensibly limited in scope and had significant legal challenges (in addition to naturally-expiring deadlines), I think these formal legal postures are quite distinct from the pragmatic effect that even the rhetoric about such immigration restrictions would have on prospective foreign students. We should know more next month.

Second, the New York bar is by far the most popular bar exam for foreign attorneys. This year, first-time test-takers from foreign countries had a whopping 57% pass rate, dramatically up from the historic 42%-46% pass rate in recent years. I don't know what would cause such an increase--more student from English-speaking countries; better bar prep; or any of a number of factors. But it's worth noting in light of my earlier concerns about the low bar pass rates. (The same kind of improvement took place in Texas: first-time pass rates among July test-takers rose from 20% in 2015 and 25% in 2016 to 44% in 2017.) Not all have secured a US non-JD degree, but many do as a prerequisite to taking a state bar exam.

nonjdonlinevtradenrollment.png

Third, law schools have discovered online non-JD legal education. It's not clear how such degrees fit into the overall marketplace (any more so than non-JD degrees more generally), and it might be that such opportunities will offset at least some of the loss of other non-JD enrollment.

Indeed, breaking down traditional versus online non-JD enrollment in the last few years, online non-JD enrollment is up significantly, and traditional non-JD enrollment has flattened. Much of the most recent growth, then, has come from online non-JD degrees. While online non-JD degrees had enrollment of just 1590 in 2014, it nearly doubled to 2971 in 2016--and I expect is still larger for Fall 2017.

Only 38 schools had online non-JD programs in Fall 2016, but even that figure is deceiving. An eclectic crop of eight schools accounted for about half of all non-JD enrollment in 2016.

nonjdonlineenrollment.png

Again, the Fall 2017 figures will be released soon, and we'll see what changes to these trends have taken place. I remain interested to know the place of non-JD degrees and the future trends of enrollment, and I'll always happily report more updates here.

Why are bar exam scores improving?

The news that the mean scaled MBE score has risen for the second year in a row and is now the highest since 2013 is good news for law schools and law students. I've been tweeting the results of the comparative overall pass rates in some jurisdictions as they roll in. It shows that, as expected with an increase in the MBE, passing rates are up in most jurisdictions. That's helped by jurisdictions that have lowered the cut score: Oregon, for instance, reduced its passing score from 142 to 137, and its passing rate rose from 58% in July 2016 to 79% in July 2017. (The low point of MBE scores came in July 2015).

But, why? In 2014, I noted that it looked like bar pass rates would have a bleak (at least short-term) future. In 2016, scores slightly improved; and here in 2017, they've improved quite a bit (though well behind where they were in 2013 and the preceding decade of relatively high scores).

Schools that saw their declines in bar pass rates in September to November of 2014 would not have been able to take action on the admissions front until they admitted students who began in August 2015. (Indeed, some might have hoped it was a one-time blip and might not have reacted even then.) But we could look at a couple of things to see if their practices changed.

First, it turns out that the bottom end of the incoming classes in August 2014 had worse predictors than August 2012--but the July 2017 test-takers scored much better than the July 2015 test-takers. A whopping 146 law schools saw a decline in their 25th percentile LSAT incoming classes (i.e., the cohort most likely to fail the bar--relative, of course, to each school's LSAT profile and each jurisdiction's cut score) in that two-year period. 29 held steady in their 25th percentile, and just 14 saw an improvement.

If anything, then, we should expect bar pass scores to be much more this past July! But we also have another factor: academic dismissals. Note that the incoming class from August 2014 may have had worse credentials, but they would have completed their first year in May 2015, shortly after some schools would have been aware of the significant drop in the bar pass rates.

Professor Jerry Organ tracked attrition and noted an uptick in academic dismissals among that August 2014 incoming class by 2015--and before they took the July 2017 bar. Overall first-year attrition was up slightly, from 6.25% for the Class of 2015 to 7.04% for the Class of 2017. But attrition rose the most at schools with the lowest LSAT profiles. Among schools with a median LSAT profile below 150, attrition rose from 12.1% to 17.1% in that two-year stretch, while declining slightly at all other institutions.

Surely that can offset some of the worsening LSAT profiles. But it can hardly explain all of it. I wonder if institutions have found better strategies of intervening with at-risk students, or providing more robust bar exam support for at-risk students. Perhaps in the last couple of years, students have been sufficiently scared of failing the bar to study harder or earlier (we know that over time, a bar exam test-taker's score will improve). These are matters that institutions may have the data to examine (or may be in the process of collecting). Regardless, it remains good, albeit still slightly mysterious news--and those in legal education hope that it is the beginning of a continued trend of good news.

How a change in the bar exam cut score could alter California legal education

Virtually all the deans of law schools in California, of ABA-accredited and California-accredited schools, have come out in favor, at multiple stages, of lowering the cut score for the California bar exam. The score, 144, is the second-highest in the country and has long been this high. Given the size of California and the number of test-takers each year, even modest changes could result in hundreds of new first-time passers each test administration.

The State Bar, in a narrowly-divided 6-5 vote, recommended three options to the California Supreme Court: keep the score; lower it to 141.1; or lower it to 139. As I watched the hearing, the dissenters seemed more in favor of keeping it at 144. At least some of the supporters seem inclined to support the 139 score, or something even lower, but recognized the limitations of securing a majority vote on an issue. Essentially, however, the State Bar adopted the staff recommendation and offered these options to the California Supreme Court.

The Court could adopt none of these options, but I imagine it would be inclined to adopt a recommended standard, and probably the lowest standard at that, 139. (The link above includes the call from the Supreme Court to evaluate the appropriateness of the cut score, a hint, but hardly definitive, that it believes something ought to be done.)

What surprised me, however, is that there would be such unanimity among law deans, because the impact on legal education could be quite significant--and not benefit all institutions equally. Put another way, I understand the obvious short-term benefit for all institutions--some number of law school graduates who previously might have failed the exam would pass, redounding to the benefit of the institution and those graduating classes.

But that, in part, assumes that present circumstances remain the same. Invariably, they will not. Let me set up a few things that are likely to occur, and then game out some of the possible impacts these changes might have on legal education--all on the assumption that the cut score drops from 144 to 139.

First, the number of passers will increase fairly significantly. About 3480 people passed the bar when 8150 took it in July 2016 bar exam. That included about 3000 first-time passers among 5400 first-time test-takers. Bar test-takers are also up significantly this test (in part likely because of the reduction from three days to two). We should expect that number in this cohort to rise to about 4100 passing--and probably more this administration, given that there were more test-takers. We may expect more out-of-state attorneys, or people who'd failed and given up, to start attempting the test again. Statistics also indicate that the greatest increase in new attorneys will tend to be racial minorities, who have historically passed the bar exam at lower rates.

The change will also disproportionately benefit California-accredited schools: while ABA-accredited schools on the whole would see a 17% increase in pass rates, California-accredited schools would see about a 70% increase in pass rates. (Granted, far fewer graduates from these schools take the bar--only about 100 passed the July 2016 bar exam.)

Additionally, we know that this year's test-takers scored better nationwide. If that trend translates to California, too, we would expect a few hundred more on top of that figure. And we may also expect an increase of test-takers to linger for a long period of time if more people are attracted to California because of it has a modestly easier test to pass.

This obviously, in the very short term, primarily benefits those students who scored between a 139 and a 144, but would have failed the bar exam, and schools with those student populations. In the slightly longer term, it will benefit students who scored less than a 139 and on repeat have a much higher chance of securing a 139 than a 144.

About 700 to 800 (or potentially even more, depending on the volume of test-takers) extra attorneys into the system per July, and some smaller number of extra attorneys per February, should slowly exert changes to attorney prices in California, as Professor Michael Simkovic has reasoned. More lawyers means more competition, which means that prices should drop, particularly among attorneys catering to more price-sensitive clients (no one thinks Vault 100 law firms will start slashing California salaries!). It's worth noting, too, that this change may be more gradual at first--there has been a drop in test-takers overall, so the increase in pass rates may not be as dramatic unless (or until) test-taking volume rebounds to previous highs. (For instance, in the July 2013 exam, nearly 5000 passed the exam among 8900 test-takers.)

Professor Robert Anderson and I also indicated that we would expect more attorneys who would face discipline. Currently, we estimate those who score a 144 on the bar exam ultimately face a career likelihood of facing discipline at around 9%. (This compares to the overall likelihood of about 5% at 35 years since admission to the bar.) Those with a 139, we project, would likely face a career likelihood of facing discipline at around 12%. The entering cohort would have a somewhat higher likelihood of facing career discipline at some point a 35-year career.

Finally, some law schools will disproportionately benefit, typically those schools at the lower end of the performance—but not whose student bodies perform at the very bottom among law schools. If the cut score is lowered from 144 to 139, schools who had a significant “middle” of the curve, with the bulk of their graduates scoring in a range around 135 to 145, should see the bulk of improvement.

The chart below illustrates a very rough projection of the improvement in performance of each school from the July 2016 bar exam if the score had been lowered to 139. This is very rough because many factors, particularly the distribution of the students at each school, and should be taken only as rough estimates—any figure could easily be a few percentage points higher or lower; and complicating the estimate is that the July 2017 results would, of course, look different. I’m simply trying to fit the projection to last year for some reference.

As you can see, in that middle band of 12 schools, those between Cal Western and Whittier, we would expect to see gains ranging from 14 to 21 points. The 11 schools at the top of the chart would generally see more modest gains of around 8 to 12 points. The 10 schools at the bottom of the chart would also see more modest improvement, typically 6 to 11 points. (The asterisks on the chart are notations for California schools that are not accredited by the American Bar Association.) There are over 50 law schools in California, but not all had sufficient test-takers to be reported in the California data.

What might these factors do to legal education in California? Potentially, quite a bit. I sketch out some possible outcomes—with an emphasis on their potentiality. A change from 144 to 139 is somewhat modest but, in a state as large as California with as many law schools and lawyers, could have significant effects. Here are a few possible things that could occur:

* * *

At least some law schools will admit larger classes. To the extent law schools were reluctant to admit larger classes because of concerns about bar passage rates, those schools will be more inclined to admit larger student bodies. Of course, there are still other reasons that schools may not increase their class sizes, or at least not substantially—they are concerned about their LSAT and UGPA medians for USNWR rankings purposes, they may be worried about finding meaningful legal employment for a larger number of graduates, and so on. But, at least one barrier in the admissions calculus has been partially removed.

Higher-ranked law schools may begin admitting more students that recently historically matriculated to lower-ranked law schools. That is, a new kind of competition may begin. In light of the thought mentioned above, it may not simply be that schools admit larger classes; they may be grabbing applicants who would have attended lower-ranked schools.  This would exert downward pressure on lower-ranked schools in the event that competition for their prospective students increased.

Higher-ranked law schools may see improved racial diversity profiles among incoming classes, potentially at the expense of lower-ranked schools. This is good news for highly-ranked schools and students from racially diverse backgrounds. The lower score will tend to benefit racial minorities, as the data has shown that minorities fail the bar at higher rates. So highly-ranked schools can admit more diverse student bodies with greater confidence of their success. Of course, this will exert downward pressure on lower-ranked schools, who may see their diversity applicant pools dwindle or face pools of applicants with worse predictors than in past years.

Law schools will experience more price sensitivity from prospective law students. That is, the value of the law degree should decline in California, as the volume of attorneys increases and the price for lawyers drops. That should, in turn, make law students more skeptical of the existing value proposition of a law degree. Law schools that have relied on high tuition prices have benefited from the high bar exam cut score, because opportunities for attorneys have been relatively scarce; the drop in cut score will dilute the value of the degree and perhaps require some cost-cutting at law schools. This is not to say that an artificial constriction on the supply of lawyers is a good thing because it props up costs (in my personal view, I think it's quite a bad thing); but, it is to say that lowering the score will have the effect of making cost-sensitivity an increasing possibility.

California-accredited law schools will have opportunities to thrive. Look again at the chart above. San Joaquin (which had 45 first-time test-takers in July 2017) would have a projected bar pass rate of 50%. Lincoln Sacramento (which had 42 first-time test-takers) would have a projected bar pass rate of 47%. These exceed some ABA-accredited schools and start to look quite attractive to prospective law students. That’s particularly true given the tuition at these institutions. The figure below displays the full-time academic year tuition in 2016 for each of these institutions. (For institutions on the credit-hour payment model, I used 28 academic units; for Lincoln Sacramento, a four-year program, I took the total price and divided by three.) I put the schools in rank order of their (projected) bar exam performance. (As a caveat, the actual price at many institutions is much lower because many students receive scholarships that discount tuition; but, for present comparative purposes, I'm using sticker price.)

(It's worth noting in the chart above that an institution like La Verne, which charges much lower tuition than peer institutions, may see a similar benefit.) For those who oppose the regulatory burden of ABA-accreditation and wish that non-accredited institutions have an opportunity to thrive, California (with more than 30 non-ABA-accredited schools) may offer a more meaningful experiment in that effort if the cut score is lowered.

Negative impact in USNWR for elite schools, and positive impact in USNWR for more marginal schools. This category may not be immediately obvious to observers considering bar exam pass rates. That is, some might ask, wouldn't higher bar exam passing rates improve a school's USNWR profile? Not necessarily--particularly not if the overall passing rate increases.

USNWR measures bar pass rate not in absolute terms but in relative terms--the margin between a school's first-time passing rate in a jurisdiction and that jurisdiction's overall pass rates. If School A has a passing rate of 90% and School B 75%, showing some gap that's only part of the story: School A had a 90% rate in a jurisdiction with an overall rate of 60%, which means it actually did quite well; but School B had a 75% rate in a jurisdiction with an overall rate of 80%, which means it actually did poorly. USNWR measures that relative performance. UPDATE: I edited this for some clarity in the hypothetical.

So if School A sees its passing rate increase to 93%, but the jurisdiction's overall passing rate increases to 85%, that's bad for School A in USNWR terms--its ability to outshine others in the jurisdiction has dwindled. In a state as large as California and with such a relatively low first-time overall passing rate, this gives elite schools an opportunity to shine.

Stanford, for instance, boasted a 91% first-time bar passage rate in a jurisdiction with a 56.3% first-time pass rate, a 1.62 ratio. If the bar pass cut score is dropped to 139, the bar projects a first-time pass rate of 64.5%. Even if its pass rate increases to a projected 96%, its ratio drops to 1.49, a 0.12-point drop. The same holds true for institutions like USC (-0.08), UCLA (-0.03), and Berkeley (-0.06). These are just one factor in the USNWR ratings, and these figures are ultimately normalized and compared with other institutions nationally, but it will marginally hurt each of these schools as an institution in the rankings--even though it might benefit a small cohort of graduates each year taking the bar exam.

In contrast, schools that have had below-average bar exam performance would see a significant increase—some of them in my projections moving up 0.2 points in their ratios or even more. If the school is in the unranked tier, it might help get the school into the rankings; if they are ranked lower, it might help them move up the rankings, an added benefit to their graduates passing the bar at higher rates.

* * *

I’ll emphasize what I’ve mentioned repeatedly before but is too often lost when blog posts like this are shared. I have no particularly strong views about what the bar exam cut score ought to be—where it is, a little lower, much lower, or anything else. There are costs and benefits that go along with that, and they are judgments I confess I find myself unable to adequately assess.

But, these are my preliminarily thoughts on things that might happen if the cut score were dropped to 139. Granted, they are contingent on many other things, and it is quite possible that many of them do not happen. But they are a somewhat-evidence-based look at the future. And they show that the change in cut score may disproportionately affect some institutions in ways beyond the short-term bar exam results of cohorts of graduating law students. Time will tell how wrong I am!

Bar exam scores rebound to highest point since 2013

After last year's slight year-over-year improvement in bar exam scores, bar exam scores are up again. The scaled mean of the Multistate Bar Exam rose 1.4 points to 141.7, the highest since 2013, which was 144.3, shortly before a hasty collapse in scores. (The MBE score is a good indicator of bar pass rates to come nationwide, but it's hardly a perfect indicator in every jurisdiction.)

scaledmbescores2017.png

For perspective, California's "cut score" is 144, Virginia 140, Texas 135, New York 133. A bar score of 141.7 is comparable to 2014 (141.5), 2005 (141.6), and 2003 (141.6) in recent years.

This is good news for test-takers and law schools--perhaps the qualifications of students have rebounded a bit as schools improved their incoming classes a few years ago; perhaps students are putting more effort into the bar than previous years; or other factors. We should see a modest rise in pass rates in most jurisdictions, comparable to where they were three years ago.

Note: I chose a non-zero Y-axis to show relative performance.

An odd and flawed last-minute twist in the California bar exam discussion

My colleague Rob Anderson last night blogged about the strange turn in a recent report from the staff at the California State Bar. Hours ahead of today's meeting of the Board of Trustees, which will make a recommendation to the California Supreme Court about the appropriate "cut score" on the bar exam, new information was shared with the Board, which can be found in the report here. (For background on some of my longer thoughts on this debate, see here.)

The report doubles down on its previous claim that there is "no empirical evidence available that indicates California lawyers are more competent than those in other states." (As our draft study of the relationship between attorney discipline and bar scores in California discusses, we concluded that we lacked the ability to compare discipline rates across states because of significant variances in how state bars may handle attorney misconduct.)

But it's now added a new claim: "Nor is there any data that suggests that a higher cut score reduces attorney misconduct." Our paper is one empirical study that expressly undermines this claim. Rob digs into some of the major problems with this assertion and the "study" that comes from it; his post is worth reading. I'd like to add a couple more.

First, the paper makes an illogical jump: "Nor is there any data that suggests a higher cut score reduces attorney misconduct" to "But based on the available data, it appears unlikely that changing the cut score would have any impact on the incidence of attorney misconduct." These are two different claims. One is an absence of evidence; the other is an affirmative finding relating to the evidence. Additionally, the adjective "unlikely" adds a level of certainty--how low is the probability? And on what is this judgment made? Furthermore, the paragraph is self-refuting: "Given the vast differences in the operation of different states' attorney discipline systems, these discipline numbers should be read with caution." Caution indeed--perhaps not read at all! That is, there's no effort to track differences among the states and control for those differences. (This is a reason we couldn't do that in our study.)

Apart from, as Rob points out, other hasty flaws, like misspelling "Deleware" and concluding that California's discipline rate of 2.6 per thousand is "less than a third" of "Deleware"'s 4.7 per thousand, it's worth considering some other problems in this form of analysis.

At a basic level, in order to compare states based on discipline rates, it must be the case that the other factors do not differ dramatically among states. But if the other factors do not differ dramatically among states, and bar pass score also does not matter, then the states should have roughly equal rates, which they don't.

The figure itself demonstrates a number of significant problems.

First, Figure 7 compares cut score with attorney discipline. But it uses a single year's worth of data, 2015. The sample size is absurdly small--it projects, for instance, the State of Vermont's discipline rate based on a sample of 1 (the total attorneys disciplined in 2015). The ABA has such data for several years, but this report doesn't collect that. In contrast, ours uses over 40 years of California discipline data from over 100,000 attorney records.

Second, the figure doesn't control for years of practice, which can affect discipline rates. That is particularly the case if the cohort of licensed attorneys in the state skews younger or older. We find that attorneys are more likely to face discipline later in their careers, and our study accounts for years of practice.

Third, the figure doesn't recognize variances in the quality of test-takers in each state. In July 2016, for instance, California's mean MBE score was a 142.4, but Tennessee's was a 139.8. Many states don't disclose state-specific MBE data. But two states with similar cut scores may have dramatically different abilities among their test-takers, some with disproportionately higher scores. Our study accounts for differences in individual test-taker scores by examining the typical scores of graduates of particular law schools, and of the differences in typical scores between first-time test-takers and repeaters.

Fourth, the figure treats the "cut score" as static in all jurisdictions, when it has changed fairly significantly in some. This is in stark contrast to the long history of California's cut score. California has tethered its 1440 to earlier standards when it sought applicants to score about 70% correct on a test, so even when it has changed scoring systems (as it did more than 30 years ago), it has tried to hold that score as constant as it can. Other states lack that continuity when adopting the MBE or other NCBE-related testing materials, have changed their cut scores, or have altered their scoring methods. Tennessee, for instance, only five years ago adopted scaling essay scores to the MBE, and failure to do so assuredly resulted in inconsistent administration of standards; further, Tennessee once permitted those with a 125 MBE to pass with sufficient "passing" scores on the unscaled essays. South Carolina at one time required a 125 MBE score, and didn't scale its essays. Evaluating state attorney discipline rates from attorneys admitted to the bar over several decades based on a cut score from the July 2016 test cannot adequately measure the cut score.

Let me emphasize a couple of points. I do wish that we had the ability to compare attorney discipline rates across states. I wish we could dive into state-specific data in jurisdictions where they changed the cut score, and evaluate whether discipline rates changed among the cohorts of attorneys under different standards.

But one of the things our study called for was for the State Bar to use its own internally-available data on the performance of its attorneys on the bar exam, and evaluate that when assessing discipline. The State Bar instead chose this crude and flawed process to demonstrate something else.

Finally, let me emphasize one last point, which I continue to raise in this discussion. Our study demonstrates that lower California bar scores correlate with higher attorney discipline rates, and lowering the bar score will result in more attorneys subject to discipline. But, of course, one can still conclude in a cost-benefit analysis that this trade-off is worth it--that the discipline rates are not sufficient for necessary concern, that they often take years to manifest, that access to justice or other real benefits are worth the trade-off, and so on.

But it is disappointing to ignore or use deeply flawed data about the relationship between attorney discipline and the bar exam cut score in this process, particularly when dumped the night before the Trustees meet to evaluate the issue.