Remembering the Armenian Genocide

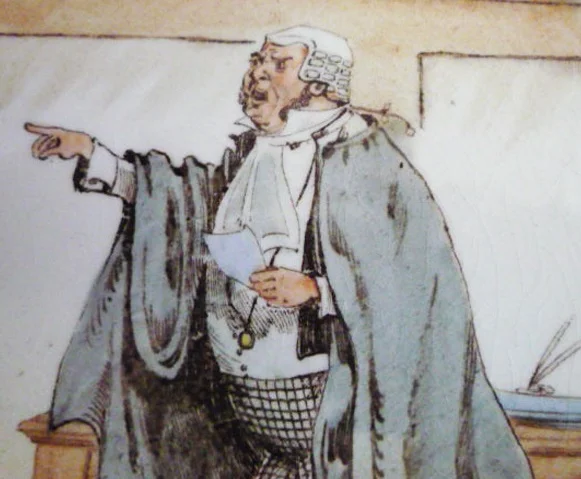
A statue in Detroit, Michigan, erected in memory of Gomidas Vartabas and the victims of the Armenian Genocide, via Wikipedia.

This blog, sometimes, is about elections. Candidates in elections behave differently than men and women serving as representatives or senators or governors or presidents. They say different things. They emphasize different things. It's a very real part of the political process, whether those differences are good or bad, whether those differences are right or wrong.

It is one thing when presidential candidates have promised, or currently promise, to recognize the Armenian Genocide. And not with recognition of a "tragedy," or of "terrible events." But of using that word, "genocide."

The word "genocide" obviously evokes serious reactions. The Holocaust is probably the first that comes to mind. Poll most Americans about another genocide, and you might find a few scattered responses about Rwanda, Bosnia, or Cambodia.

But few Americans would call to mind the Armenian genocide. It began in 1915, one hundred years ago, in the middle of the Great War. More than a million Armenians were killed. Indeed, the word "genocide" was coined in 1944 in the midst of World War II, but it arose upon reflection of the history of such killings, for Adolf Hitler was not the first--the Armenians had been sought out before that. It was striking when I first read of it at some point in college--I had been completely unaware of it. (I've have a deep interest in the history of World War I ever since.) The Armenian Genocide is not widely taught. In many places, it is essentially forgotten.

But politicians behave differently as candidates than they do as elected officials. Both Presidents George W. Bush and Barack Obama promised as candidates to recognize the Armenian Genocide, and both refused to do so when they took office. The office changes behavior--there is fear of offending American allies with the word "genocide," and politicians behave differently. But it is perhaps that very power of the office that should be used to call Americans, and the world, to recognize and acknowledge and reflect upon that genocide, that historical fact, that truth that some would deny in the hope that all would forget.

April 24, 2015 marks the one hundred year commemoration of the Armenian Genocide. Pepperdine Law has an active and engaging Armenian Law Students Association, which commemorated the event this month through some moving tributes. Many others around the world will also remember that genocide. I close, then, with the right words from President Ronald Reagan's proclamation, April 22, 1981:

"Like the genocide of the Armenians before it, and the genocide of the Cambodians which followed it -- and like too many other such persecutions of too many other peoples -- the lessons of the Holocaust must never be forgotten."

Visualizing legal employment outcomes in DC-Maryland-Virginia in 2014

Following up on my post regarding California employment outcomes, here are outcomes for law schools in the District of Columbia, Maryland, and Virginia. (Details about the methodology, and the USNWR methodology basis, are there.) The chart is sorted by non-school-funded jobs (or "full-weight" positions). The table below the chart breaks down the raw data values for the Classes of 2013 and 2014, with relative overall changes, and is sorted by total placement (as USNWR prints). The raw data (and overall percentages) includes all full-time, long-term, bar passage-required and J.D.-advantage positions, with a parenthetical with the total number of school-funded positions.

Total jobs in these bar passage-required and J.D.-advantage positions declined slightly from 3207 to 3119, due in part, I would assume, from a significant decline in school-funded positions, from 357 to 271. But there were about 250 fewer graduates, from 4253 to 3992, which means that overall prospects improved for graduates: the overall employment rate was 78.1% (including all funded positions). More granular data is available at each school's website and forthcoming in spreadsheet format from the ABA.

Peer score School 2014 YoY% raw 2013 raw
4.3 University of Virginia 96.6% -0.4 337 (34) 97.0% 353 (59)
3.4 George Washington University 89.2% 0.2 521 (78) 89.1% 537 (89)
4.1 Georgetown University 87.2% -2.5 546 (72) 89.8% 579 (80)
3.2 William and Mary Law School 82.3% -1.5 177 (24) 83.9% 182 (48)
2.5 University of Richmond 81.9% 10.0 122 (0) 71.8% 102 (0)
2.7 George Mason University 79.9% 5.4 147 (7) 74.5% 190 (7)
2.9 University of Maryland 75.3% 7.6 223 (2) 67.7% 197 (16)
3.1 Washington and Lee University 74.8% 11.2 95 (1) 63.6% 91 (0)
2.1 Catholic University of America 70.9% 2.5 127 (0) 68.5% 163 (0)
2.0 University of Baltimore 70.4% 5.8 221 (0) 64.6% 201 (0)
2.8 American University 70.2% 9.7 323 (48) 60.6% 307 (54)
2.3 Howard University 65.5% -0.5 74 (1) 65.9% 91 (1)
1.3 Regent University 63.1% -1.4 77 (0) 64.5% 89 (0)
1.2 Liberty University 56.6% 10.3 43 (1) 46.2% 43 (2)
1.4 District of Columbia 44.7% 3.4 46 (2) 41.3% 33 (1)
1.2 Appalachian School of Law 42.1% -13.6 40 (1) 55.7% 49 (0)

Visualizing legal employment outcomes in California in 2014

As is the case every year, the U.S. News & World Report releases its rankings with data that becomes obsolete in a matter of weeks. Its rankings include the Class of 2013 employment data. But schools have released their Class of 2014 employment data. The ABA has not yet released the spreadsheet of the data, but individual schools have. I thought I'd recreate last year's data on California law school employment outcomes, with a couple of tweaks due to external changes.

Complaints from law school deans in California were heeded. Employment outcomes are now reported at ten months' after graduation instead of nine. But the decline in bar pass rates for the Class of 2014 meant, in all likelihood, a more challenging environment.

The USNWR methodology also changed slightly, too. It still prints the "employed" rate as "the percentage of all graduates who had a full-time job lasting at least a year for which bar passage was required or a J.D. degree was an advantage." But this year, it announced that would not give "full weight" in its internal ranking metric to jobs that were funded by the law school. (Many law schools have migrated toward providing funding for these types of positions; we'll see if that was motivated by the USNWR methodology, and, if so, we'll see if any react by rolling back those programs.) USNWR gives other positions lower weight, but these positions are not included in the ranking tables. And while it includes J.D. advantage positions, there remain disputes about whether those positions are really as valuable.

A few things jump out from the data. First, there were fewer graduates: there were about 400 fewer graduates from California schools, from 5185 for the Class of 2013 to 4731 for the Class of 2014.

Second, total job placement remained flat. Between 2800-2900 California graduates obtained unfunded positions in the last three years. This year shows that 2849 obtained these unfunded, full-weight positions, good for 60.2% of California graduates--a percentage better than previous years, no doubt, because of the smaller graduating classes.

Third, school-funded positions continue to rise. There were 145 school-funded positions from California schools .Two schools significantly increased school-funded positions: USC went from 12 to 33 (15% of the graduating class), and UC-Irvine went from 0 to 13 (14% of the graduating class). Davis added 9, and Stanford and Loyola each added 5 more school-funded positions, among other more modest changes. (Keep in mind that the Class of 2012 had just 24 such school-funded positions among California schools.)

Below is a graph of the unfunded and funded full-time, long-term, bar passage-required and J.D.-advantage positions. The chart below that reflects the same data, with the 2016 USNWR peer score, the full-time, long-term, bar passage-required and J.D.-advantage positions, along with year-over-year increase or decline in points from the 2013 rate. It then lists the raw number of students who obtained such positions, along with a parenthetical notation of how many of those positions were school-funded. The same is listed for 2013.

Peer score School 2014 YoY% raw 2013 YoY% raw
4.4 CALIFORNIA-BERKELEY, UNIVERSITY OF 95.5% 5.1 274 (20) 90.4% 2.3 272 (25)
4.8 STANFORD UNIVERSITY 93.6% 0.8 180 (10) 92.8% -3.9 180 (5)
3.9 CALIFORNIA-LOS ANGELES, UNIVERSITY OF 87.5% 5.3 294 (32) 82.2% 5.1 273 (34)
3.5 SOUTHERN CALIFORNIA, UNIVERSITY OF 85.7% 14.7 186 (33) 71.0% -1.4 169 (12)
3.0 CALIFORNIA-IRVINE, UNIVERSITY OF 84.9% 18.3 79 (13) 66.7% -19 56 (0)
3.3 CALIFORNIA-DAVIS, UNIVERSITY OF 81.7% 8.2 138 (19) 73.5% 5.6 144 (10)
2.5 LOYOLA LAW SCHOOL-LOS ANGELES 71.0% 11.8 281 (10) 59.1% 10.4 230 (5)
2.6 PEPPERDINE UNIVERSITY 59.6% -5.2 118 (1) 64.8% 6.6 138 (0)
1.9 MCGEORGE SCHOOL OF LAW 59.4% 12.5 111 (1) 46.9% 3.1 149 (3)
2.6 SAN DIEGO, UNIVERSITY OF 58.1% -2.0 155 (1) 60.1% 8.4 191 (0)
3.1 CALIFORNIA-HASTINGS, UNIVERSITY OF 57.7% 10.5 232 (2) 47.2% -4.5 176 (2)
1.5 CALIFORNIA WESTERN SCHOOL OF LAW 57.1% 15.4 125 (0) 41.6% -7.8 117 (0)
1.9 SOUTHWESTERN LAW SCHOOL 55.9% 3.9 175 (1) 52.0% -4.5 156 (0)
1.8 CHAPMAN UNIVERSITY 55.1% 9.4 76 (0) 45.7% -2.1 85 (0)
nr LA VERNE, UNIVERSITY OF 50.0% 9.3 22 (0) 40.7% 4.2 35 (1)
2.4 SANTA CLARA UNIVERSITY 47.9% -8.3 125 (0) 56.2% -0.2 181 (1)
2.1 SAN FRANCISCO, UNIVERSITY OF 46.7% -0.8 92 (0) 47.5% 14.9 95 (1)
1.1 WESTERN STATE COLLEGE OF LAW 45.3% 1.4 68 (0) 43.9% 4.1 54 (0)
1.4 WHITTIER LAW SCHOOL 43.8% 13.3 85 (0) 30.5% -15.4 64 (0)
1.3 THOMAS JEFFERSON SCHOOL OF LAW 41.0% 0.0 120 (0) 41.0% 4.8 120 (0)
1.6 GOLDEN GATE UNIVERSITY 31.7% 2.7 58 (2) 28.9% 1.8 66 (1)

Here we go again: February 2015 bar pass rates down over last year

For February 2016 information, please click here.

This post has been updated with a visual representation of the decline in the mean MBE score.

In pursuit of a seemingly endless quest to determine what caused the July 2014 decline in bar pass rates, there's a simple solution: wait and see. Subsequent administrations of the test would reveal whether the July 2014 test was a one-time aberration or reflected an actual decline in student quality.

As the February 2015 bar exam results start to trickle in, the answer, as I've been inclined to suggest of late, is increasingly likely to be the latter.

It should be noted that some state bars, like Illinois, have begun to pull up the ladder on young Millennials increase the score required to pass. That will likely independently increase the failure rate in many jurisdictions in the years to come.

Additionally, the February bar exam is something different in kind. It usually includes fewer first-time test-takers, which means that the overall pass rates are usually lower. (People who fail the bar once are much more likely than others to fail it again.) There are often with much smaller pools of test-takers, making a single jurisdiction's pass rate subject to apparent significant fluctuations.

At this stage, too, like last year, most jurisdictions only disclose the overall pass rate, lumping together first-time test-takers and repeaters, ABA and non-ABA law school graduates, which is the least meaningful metric for evaluating performance across administrations.

Then again, if the theory is that the July 2014 was a one-time aberration, we might see an increase in highly qualified repeaters who are much more likely to pass the test if they "ought" to have passed the first time around--meaning, perhaps, that, all things being equal, we may see pass rates increase in the February 2015 administration over the February 2014 test, if the July 2014 test was attributable to non-test-taker-related factors.

The preliminary data, however, reflects a decline in pass rates largely across the board (with no ExamSoft debacle to complicate our analysis).

Granted, not only are we dealing with the caveats above, but these jurisdictions are (mostly) smaller than the typical jurisdiction, which makes potential distortions even more likely. Further, the declines are (somewhat) smaller (and, perhaps, closer to what one would expect with the decline of predictors) than the ones initially observed last July. And until a jurisdiction discloses the national mean scaled MBE score, we don't have the cleanest comparison. But given that early signs last year pointed toward the ultimate trend--despite most of the same caveats--these might serve as a warning.

Overall bar pass rates, February 2015 v. February 2014

Florida, -8 points* (February 2014: 72%; February 2015: 64%)

Kansas, -4 points (February 2014: 86%; February 2015: 82%)

Kentucky, -7 points (February 2014: 77%; February 2015: 70%)

Illinois, about -5 points (February 2014: 75%**)

Iowa, -14 points (February 2014: 86%; February 2015: 72%)

Missouri, -3 points (February 2014: 81%; February 2015: 78%)

New Mexico, -1 point (February 2014: 81%; February 2015: 80%)

New York, -4 points (February 2014: 47%; February 2015: 43%)

North Carolina, -13 points (February 2014: 56%; February 2015: 43%)

North Dakota, -7 points (February 2014: 62%; February 2015: 55%)

Ohio, unchanged (February 2014: 64%; February 2015: 64%)

Oklahoma, -3 points (February 2014: 70%; February 2015: 67%)

Oregon, -2 points (February 2014: 66%; February 2015: 64%)

Pennsylvania, -4 points (February 2014: 57%; February 2015: 53%)

Tennessee, -10 points (February 2014: 64%; February 2015: 54%)

Vermont, -20 points (February 2014: 68%; February 2015: 48%)

Virginia, unchanged (February 2014: 59%; February 2015: 59%)

Washington, -5 points (February 2014: 71%; February 2015: 66%)

West Virginia, -2 points (February 2014: 70%; February 2015: 68%)

We have small additional data points reflecting that perhaps it's not quite so bad. North Dakota disclosed its first-time pass rate, which increased 7 points--of course, only 31 were first-time takers last year, which, again, reflects some of the caveats listed above. (UPDATE: Pennsylvania's first-time pass rate was 69%, a 3-point drop. Oregon's first-time pass rate was 69%, an 11-point drop.)

I hope to occasionally update this post in the weeks to come, and we'll see if these jurisdictions are an aberration or a sign of things to come.

*Florida's statistics include only first-time exam takers.

**While Illinois has not disclosed its pass rate, its percentile equivalent chart suggests a drop of about 5 points. A scaled score of 264 is required to pass. A scaled score of 270 was the equivalent of the 40th percentile in February 2014; it's the equivalent of the 46th percentile in 2015. A scaled score of 260 was the equivalent of the 27th percentile in February 2014; it's the equivalent of the 31st percentile in 2015. (Although I confess I don't understand how Illinois disclosed an overall 75% pass rate when it conceded that 27% of test-takers scored at least 4 points below the passing score in February 2014, unless they have extremely generous re-scoring and re-evaluation.)

UPDATE: The Pennsylvania bar results reveal that the national scaled MBE score for February 2015 was a 136.2. That's a 1.8-point drop from the February 2014, and, while not the steepest decline or the lowest score in the last decade, is certainly close to it.


The wrong sort of law school applicants, visualized

I have just been thinking, and I have come to a very important decision. These are the wrong sort of bees.

Are they?

Quite the wrong sort. So I should think they would make the wrong sort of honey, shouldn’t you?

Would they?

Yes. So I think I shall come down.
— A.A. Milne, Winnie-the-Pooh (1926)

There's good news and bad news for law schools. The good news is that total law school applicants appear to be reaching the bottom. After projections last year that the worst may be yet to come, it appears that the Class of 2018 will have only slightly fewer applicants than the Class of 2017. Current projections are about a 2.8-point drop in applicants, and that gap may narrow if recent trends of late applicants continue.

Of course, it doesn't take much effort to notice that despite the bottoming out, it's still very much below recent trend, both for projected applicants and projected matriculants.

But the bad news is that the quality of the applicants. In short, the wrong sort of applicants are applying.

LSAC sends occasional updates, its "Current Volume Summary," describing trends in applicants. At this point last year, LSAC reports it had 87% of the preliminary final applicant count, which means we are fairly late in the applicant cycle.

It also circulates a breakdown of the high LSAT score of 2015 ABA applicants, with the percentage change from last year. The numbers are, I think, fairly shocking.

While the raw totals of applicants are largely unchanged (i.e., down slightly), the quality of those applicants is down fairly significantly. The only places that have seen an increase in applicants are those scoring a 144 or lower.  Applicants scoring a 145 to 149 are largely flat. In contrast, applicants with a high score of 165 or higher are down double-digits, with the steepest decline among the most elite applicants.

Granted, there are only a handful of those with a high score of 175 or higher (this year, just 481 applicants). But the numbers do reflect the predicament law schools find themselves in. They can certainly fill their classes with applicants, from a pool of comparable size. But the composition of the pool is worse than it was even last year. And as school confront lower quality applicants, with lower predictors, they face the back-end problem of higher bar failure rates, and likely adverse employment outcomes.

So the first level of data tells us some good news for law schools--applicants are not down as much as one might have feared, and the bottom may be approaching. But the second level of data tells us some bad news--applicant quality has worsened, in such a way that law schools are still confronted with as difficult a choice as if they had simply experienced an overall drop in applicants. How schools react remains to be seen.

Fictional Attorney of the Month: Serjeant Buzfuz

Charles Dickens's Sydney Carton may be his most well-known attorney, but Serjeant Buzfuz is perhaps the most amusing. Mr. Buzfuz represents the widow Mrs. Bardell in a suit against Mr. Pickwick, the lead character in The Pickwick Papers, for a breach of a promise to marry.

In court, Mr. Buzfuz's rhetorical opening has its desired effect: "A visible effect was produced immediately; several jurymen beginning to take voluminous notes with the utmost eagerness." Some of my favorite, and deeply Dickensian, passages from the oratory to the jury:

Before the bill had been in the parlour-window three days—three days, gentlemen—a being, erect upon two legs, and bearing all the outward semblance of a man, and not of a monster, knocked at the door of Mrs. Bardell’s house.
...
These letters, too, bespeak the character of the man. They are not open, fervent, eloquent epistles, breathing nothing but the language of affectionate attachment. They are covert, sly, underhanded communications, but, fortunately, far more conclusive than if couched in the most glowing language and the most poetic imagery—letters that must be viewed with a cautious and suspicious eye—letters that were evidently intended at the time, by Pickwick, to mislead and delude any third parties into whose hands they might fall. Let me read the first: ‘Garraway’s, twelve o’clock. Dear Mrs. B.—Chops and tomato sauce. Yours, Pickwick.’ Gentlemen, what does this mean? ‘Chops and tomato sauce. Yours, Pickwick!’ Chops! Gracious heavens! and tomato sauce! Gentlemen, is the happiness of a sensitive and confiding female to be trifled away by such shallow artifices as these?

It is for the absurdity of circumstantial evidence and the power of his rhetoric that Serjeant Buzfuz is the Fictional Attorney of the Month.

Visualizing the grim final numbers from the July 2014 bar exam

Most by now are undoubtedly aware about the significant decline in MBE scores and bar pass rates in the July 2014 bar exam. I've recently been persuaded (but not wholly) by NCBE explanations, suggesting that the July 2014 had generally worse predictors and performed worse as a result. If true, that suggests a grim reality as predictors worsen over the next several administrations.

I had some data earlier, cobbled together from state by state data sets using overall pass rates, suggesting, among other things, that the ExamSoft fiasco was not (primarily) responsible for the decline.

The NCBE has released its statistics for the 2014 administrations of bar exams. That means we have access to complete data sets, and to more precise data (e.g., first-time pass rates instead of overall pass rates). Below is a chart of changes in first-time bar pass rates among all 50 states and the District of Columbia between July 2013 and July 2014, with some color coding relating to the MBE and ExamSoft. Thoughts below.

As noted previously, the only non-MBE jurisdiction, Louisiana, saw a significant improvement in bar pass rates among first-time test-takers. So, too, did North Carolina--an MBE and ExamSoft jurisdiction with its essays on Tuesday. Congrats to the lucky test-takers in the Tar Heel State. Elsewhere, however, you see across-the-board declines among first-time test-takers, with a modest improvements in a few of jurisdictions.

It's wait and see for the July 2015 administration to determine whether this decline is the start of a trend or, perhaps, a one-off aberration.

California poised to cut bar exam from three days to two

UPDATE: The bar voted in July 2015 in favor of the proposal, to take effect July 2017. See the update here.

Tomorrow, the Committee of Bar Examiners for the State of California meets to consider whether to cut the bar exam from three days to two days.

The proposal would result in one day of essays and one day of the MBE. The essays would include a morning of three, one-hour essays; and an afternoon of two, one-hour essays and a 90-minute performance test. As a practical matter, its most significant impact would be on the performance test, which has been a three-hour element of the exam. Each day would be weighed equally.

It would not make the exam any easier--that's a question left for the cutline for scores, which presumably would be recallibrated to reflect a comparable difficulty. Instead, it would make it less grueling for test-takers, and less expensive for all parties--one fewer day staying in a hotel, and one fewer day of material to develop and score. Further, it might speed grading, which, given California's glacial pace of scoring that postpones bar admission ceremonies into December after a student graduates in May, would benefit all parties.

The most intriguing component of the agenda item, in my view, describes the mismatch between critiques of proposed changes and the point of the exam itself:

There continues to be some confusion with regard to what the bar examination is intended to do. The examination is not designed to predict success as a lawyer or even that a lawyer is ready for the practice of law. In fact, one of the best predictors of bar examination scores is the grades an applicant received during law school. So, in one sense, the examination is confirmation that the necessary skills and knowledge were learned during the three or four years of law study, through whatever means, which are needed to show minimum competence as a lawyer. The bar examination is an examination to test minimum competence in the law.

The format of the exam, then, whether through essays or multiple choice, whether three days or two days, is not the point.

Implementation would be submitted for review in April 2015 to determine when the two-day bar, if approved, would first take place.