Updating and projecting the 2024-2025 USNWR law school rankings (to be released March 2024 or so)

Last May, I projected USNWR law school rankings based on the publicly-available employment and bar passage data. New ABA data fills out most of the rest of the rankings data. I thought I’d update and see what changed. In short, not much. It’s not surprising, as I mentioned in May that this data is not only weighted less in the rankings but less subject to change. Most of the movement essentially occurred from changes in rounding errors that pushed schools up or down a tied spot.

Some ABA has data, which I tried to fix as best I can. I also have to approximate certain measures (e.g., which GRE percentiles USNWR uses), in addition to estimates of employment rankings, but these are about as robust as one can get. Of course, the peer and lawyer-judge scores will not be available until the spring, so I use last year’s scores. These are stickiest of all and least likely to change—but, given changes in survey response rates, it’s possible there’s slightly more volatility in these metrics.

As usual, I only list the top 100. Schools are sorted by rank, and then by estimated score within the rank (e.g., if six schools are tied at 50, the school at the top of the list has the highest score and is most likely to move up, and the school at the bottom of the list has the lowest score and is most likely to move down).

School December 2023 projected rank May 2023 projected rank Current rank
Stanford 1 1 1
Yale 2 2 1
Chicago 3 3 3
Harvard 4 4 5
Virginia 4 4 8
Penn 6 6 4
Duke 6 6 5
Michigan 6 8 10
Columbia 9 8 8
Northwestern 9 10 10
Berkeley 11 10 10
NYU 11 10 5
UCLA 13 13 14
Washington Univ. 14 14 20
Georgetown 14 14 15
North Carolina 16 16 22
Texas 16 16 16
Cornell 18 18 13
Minnesota 19 19 16
Notre Dame 19 19 27
Vanderbilt 19 19 16
USC 22 22 16
Georgia 22 23 20
Boston Univ. 24 24 27
Wake Forest 24 24 22
Texas A&M 24 27 29
Florida 27 24 22
Utah 28 28 32
Boston College 28 31 29
William & Mary 28 28 45
Alabama 28 28 35
Washington & Lee 32 31 40
Ohio State 32 31 22
Iowa 34 34 35
George Mason 34 35 32
Indiana-Bloomington 36 35 45
Fordham 36 35 29
Florida State 36 35 56
Colorado 39 39 56
Arizona State 39 39 32
BYU 39 39 22
SMU 39 39 45
Baylor 39 39 49
George Washington 44 39 35
Irvine 44 45 35
Illinois 46 46 43
Connecticut 46 46 71
Davis 48 46 60
Wisconsin 48 50 40
Emory 48 46 35
Washington 48 50 49
Tennessee 48 52 51
Villanova 53 52 43
Penn State-Dickinson 53 52 89
Kansas 55 52 40
Temple 55 52 54
Pepperdine 55 57 45
Missouri 55 60 71
San Diego 55 57 78
UNLV 60 60 89
Penn State Law 60 57 80
Oklahoma 60 60 51
Wayne State 60 65 56
Cardozo 60 60 69
Kentucky 60 60 60
Loyola-Los Angeles 66 65 60
Arizona 66 68 54
Northeastern 68 65 71
Maryland 68 68 51
Richmond 68 68 60
Seton Hall 68 72 56
Cincinnati 68 72 84
South Carolina 73 77 60
Drexel 73 68 80
Nebraska 73 72 89
Georgia State 76 77 69
St. John's 76 72 60
Tulane 76 72 71
Florida International 76 77 60
Houston 76 77 60
Loyola-Chicago 76 77 84
UC Law-SF 82 82 60
Catholic 82 85 122
Drake 82 82 88
Maine 85 82 146
LSU 85 85 99
Pitt 85 85 89
Marquette 85 85 71
Belmont 89 90 105
Denver 89 90 80
New Hampshire 89 85 105
Lewis & Clark 89 90 84
New Mexico 89 93 96
Oregon 94 93 78
Texas Tech 94 97 71
UMKC 96 93 106
Case Western 96 97 80
Rutgers 96 nr 109
Dayton 96 97 111
Samford 100 nr 131
Regent 100 93 125
Duquesne 100 nr 89
Indiana-Indianapolis 100 nr 99
Miami 100 nr 71
Cleveland State 100 nr 111
West Virginia 100 nr 111

In the near future, I hope to model a few alternative rankings based on potential changes to the USNWR methodology that may be coming.

Law school 1L JD hits six-year low, non-JD enrollment trends down

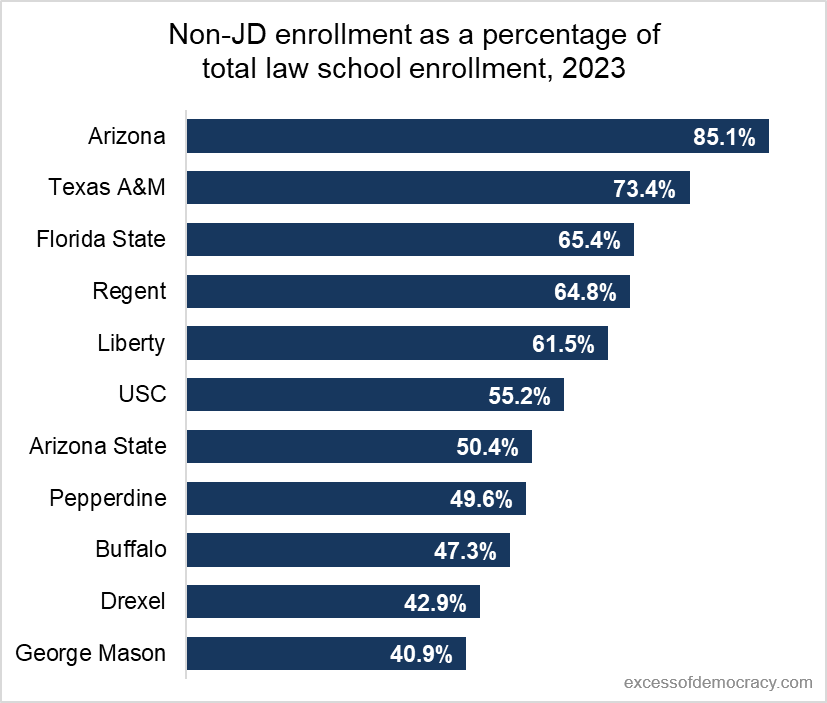
The 2023 law school enrollment figures have been released. They show the a drop in JD enrollment and a drop in non-JD enrollment. About 16% of law school enrollees are not enrolled in a JD program.

For nine of the last 10 years, 1L JD enrollment has been between 37,000 and 38,500, remarkable consistency. In 2021, it hit a recent high of 42,718, but it trended down last year, and again this year, down to 37,886 the lowest since 2017’s 37,398.

Total JD enrollment sits at 116,851, well off the peak of 2010-2011 with 147,525.

Non-JD enrollment has been more fickle in recent years. It ballooned to more than 24,000 students last year, good for more than 17% of all law school enrollees, but settled down to 21,966, 15.8% of all law school enrollees, and still consistent with recent highs.

Ten schools have at least 40% of their total overall law school enrollment made up of non-JD students in 2023.

Perhaps the most valuable legal education job in the new USNWR rankings landscape? Career development

After the USNWR law school rankings shakeup earlier this year, I pointed out that spending money on law professors would have less influence than in years past. So, where might there be incentives to spend more money?

Undoubtedly, career services and career development offices.

Now, I haven’t followed this, so I cannot possibly even know anecdotally whether this is the case, but it would be worth considering whether there are more career development personnel being hired at schools (to improve the counselor:student ratio), whether different strategies are being employed (e.g., relationship between “placement” and “development,” targeting particular types of jobs for graduates, reconsidering categories of jobs for reporting purposes, reexamination of school-funded positions, etc.), or whether those personnel are being paid more to retain successful career counselors.

But as the methodology has changed, tiny changes in employment outcomes can yield dramatically different law school rankings. Employment outcomes overwhelm every other category. Indeed, admissions is less important and outcomes like employment are dramatically more important, so much so that one might rethink admissions in light of employment more than median LSAT and UPGA scores (with lots of promise and lots of peril).

So let’s take a look at what to expect in the next USNWR law school rankings as it relates to employment outcomes.

Here are the ten schools (in alphabetical order) I project to be in or near the top 10 in employment outcomes. I show three categories of jobs: “full weight jobs,” all other jobs, and unemployed/unknown. (As an aside, some law school advertise their “full weight” employment of graduates, which is a meaningless term in the real world and refers exclusively to categories that USNWR gives “full weight” in its rankings methodology.)

This is what USNWR sees. Full weight, a variety of categories of jobs it gives lesser weight to, and unemployed. Among the top ten, you’ll see the profiles look very similar. “Full weight” jobs are between 97.8% (SMU) to 99.4% (Texas A&M). Unemployed ranges from 0% (Washington University in St. Louis) to 1.1% (Northwestern). These are highly efficient outputs for law schools.

But let’s look under the hood. Not all of these law schools get to what USNWR sees the same way. To start, USNWR includes five categories in its “full weight” jobs: full-time, long-term bar passage required jobs; BPR jobs funded by law schools; full-time, long-term, JD advantage jobs; JDA jobs funded by law schools; and students pursuing an advanced degree. Schools get there in different ways.

Schools took varying routes to get where USNWR sees them. Yale, for instance, has 6% of its grads in school-funded bar passage-required jobs, and another 6% in school-funded JD advantage jobs. The rest of the schools put between 0% and 3% of grads in school-funded bar passage-required jobs; school-funded JD advantage jobs are negligible at these other schools. Likewise, JD advantage jobs vary dramatically, from nearly zero (Virginia) to 11% (Texas A&M). Career development offices take different paths to get to “full weight” employment. (Relatively few were pursuing an advanced degree anywhere.)

One more. ABA data reveals rich classifications of jobs by several employment categories. I created six cohorts of jobs. The first are “biglaw” jobs, those at firms with 101 or more attorneys. Then, “federal clerks.” Next, “mid law” jobs, firms with 26 to 100 attorneys. Then “state clerks.” Next, “small law,” sole practitioners or those at firms with 25 or fewer attorneys. Finally, “public interest” jobs. All other job categories (regardless of duration or funding) were in a final bucket. Again, we can see that schools get to “full weight” in different ways.

Not just different ways, but pretty dramatically different ways. Placement into “Biglaw” ranged from 12% (Texas A&M) to 71% (Northwestern). Federal clerkship placement ranged from 4% (Columbia) to 24% (Yale). ”Midlaw” was a significant category for Texas A&M (12%), SMU (9%), and Washington University (8%). State clerkships were most significant at Duke (5%). “Small law” was a major category for Texas A&M (33%) and SMU (30%). Yale dominates public interest placement here (20%). Jobs that don’t fit any of these six cohorts (e.g., business, government, education, etc.) were significant at Texas A&M (30%), Washington University (22%), SMU (19%), and Yale (15%).

In short, to get to the “top ten” of “full weight” jobs, schools have taken wildly divergent approaches in achieving results. Career development offices have significantly different strategies for the school, the region, the student body, whatever one wants to think about it.

This isn’t to say that some categories of jobs are or are not better or worse, although I’m sure readers have their own thoughts. But it’s to say that USNWR rankings do not distinguish among them. And if they do not, the route to get there can be flexible and varied. This is just one snapshot into how varied those outcomes can be that get to the same USNWR end.

California has lost 4 ABA-accredited law schools in the last decade

Golden Gate has announced a closure plan for its law school program. Karen Sloan at Reuters highlights some of the trends of recent closures, a trickle we’ve seen over the years. Golden Gate was long at risk.

But California is a stark trend. Just a decade ago, in 2013, the school had 21 ABA-accredited law schools. That number has now dropped to 17 in a decade. Whittier closed, and, at the time, I suggested due to problems unique to California. Thomas Jefferson and La Verne opted to give up their ABA accreditation and be accredited only by the state of California. California lowered the cut score for its bar exam in 2020, but that appears not to have been enough to save Golden Gate.

These four schools graduated 817 JD students in 2013. That was nearly 16% of the 5184 graduates of ABA-accredited law schools that year. The closure of these schools is a major change in the legal education landscape in California.

And while the other law schools graduated 4367 students in 2013, they graduated just 3765 last year, which means they’re not exactly capturing many of the students in California who’d have attended school elsewhere.

It’s been a big decade for the shape of the legal education market in California, and how it plays out in the decades to come remains to be seen.

Law schools have shed 7% of their full time faculty in the last five years

The ABA disclosures reveal trends over time. And they reveal that law schools have shed about 7% of their full time faculty in the last 5 years, from 2017 to 2022—around 700 people (from 10,026 to 9.342). They may be partially replacing them with part-time faculty, which have increased by around 300 in that time (from 16,783 to 17,081). Or they may be “right sizing” as the long tail of the recession and the decline of interest in legal education. Or it could be that law schools are facing challenges staffing faculties. Or maybe other things altogether. (Full-time faculty include tenured, tenure track, and any other instructional faculty status, as long as they have full time employment at the law school.)

41 schools saw a 20% decline in full-time faculty over this period. And, of course, some declines can appear larger at schools with starting base faculty sizes, so I also list the total faculty in 2022 and 2017.

Law School FT 2022 FT 2017 Change
Atlanta's John Marshall 15 26 -42.3%
Pittsburgh 35 55 -36.4%
Catholic 24 37 -35.1%
Faulkner 17 26 -34.6%
Buffalo 40 61 -34.4%
West Virgnia 29 43 -32.6%
Western State 15 22 -31.8%
William & Mary 44 64 -31.3%
Kentucky 29 42 -31.0%
Denver 60 85 -29.4%
Nova Southeastern 40 56 -28.6%
Chicago-Kent 48 67 -28.4%
Barry 28 39 -28.2%
Akron 23 32 -28.1%
Chapman 36 50 -28.0%
Western New England 21 29 -27.6%
Arkansas 36 49 -26.5%
Liberty 20 27 -25.9%
Ohio Northern 18 24 -25.0%
Southern Illinois 24 32 -25.0%
American 71 94 -24.5%
Toledo 22 29 -24.1%
Cooley 41 54 -24.1%
Missouri 29 38 -23.7%
Washington 49 64 -23.4%
DePaul 36 47 -23.4%
Detroit Mercy 23 30 -23.3%
Pepperdine 40 52 -23.1%
Touro 34 44 -22.7%
Northern Illinois 24 31 -22.6%
UC-Davis 40 51 -21.6%
Loyola-New Orleans 40 51 -21.6%
Wake Forest 48 61 -21.3%
San Francisco 37 47 -21.3%
Montana 15 19 -21.1%
Indiana-Bloomington 49 62 -21.0%
New Mexico 38 48 -20.8%
District of Columbia 23 29 -20.7%
Oklahoma City 23 29 -20.7%
McGeorge 35 44 -20.5%
Samford 20 25 -20.0%

That said, 11 schools saw significant faculty growth in this period.

Law School FT 2022 FT 2017 Change
Southern 54 33 63.6%
Lincoln Memorial 22 14 57.1%
Roger Williams 32 23 39.1%
UNT Dallas 22 16 37.5%
Appalachian 13 10 30.0%
Campbell 33 26 26.9%
South Dakota 20 16 25.0%
Penn State Law 52 42 23.8%
Washington University (St. Louis) 96 78 23.1%
Florida International 39 32 21.9%
Dayton 30 25 20.0%

The deprecation of the LSAT appears to continue as LSAC drops the analytical reasoning section

In 1998, a technical study from the Law School Admission Council looked at each of the three components of the LSAT—the analytical reasoning (sometimes called “logic games”), logical reasoning, and reading comprehension. The LSAT overall predicted first-year law school grade point average. But how did each of the individual components fare?

From the executive summary:

The major results of this paper indicate that each of the operational LSAT item types has a substantial correlation with FYA, and that each is needed to obtain the reported overall correlation because no two item types are perfectly correlated with each other. The item type with the greatest predictive validity was LR with a validity coefficient of 0.483. Even though RC with a validity coefficient of 0.430 had the next greatest value, AR with a validity coefficient of 0.340 makes the greater additional contribution to the validity coefficient of the entire test as it had a much lower correlation with LR than did RC. After adjusting for the amount of predictive validity accounted for by their correlations with LR, the remaining degree of correlation of AR with FYA was 0.124 whereas the corresponding value for RC was 0.107.

The results also verified that the interrelationships among the item types in the law school applicant pools were the same as those previously found for all test takers for a fixed LSAT form. The results verified that LR and RC remain very highly correlated (0.760), while AR is less correlated with LR or RC, but still strongly so, with correlations of 0.510 and 0.459, respectively.

The implications of this study are that all three item types have substantial correlations with FYA and should all remain as part of the LSAT to maintain the current level of overall predictive validity.

A few things are notable. The three sections are correlated with each other, but the analytical reasoning less so than the others. Nevertheless, the analytical reasoning section contributed significantly to the validity of the LSAT, as it was testing different skills that went into the overall predictive power of the LSAT.

Of course, none of the sections of the LSAT is a “real world” scenario for what lawyers “do,” nor does it simulate what a legal exam does. But it gets at different skills (pure logic, logic in reading, reading comprehension) that all have various applications in the first-year law school exam and the practice of law.

As I’ve been pointing out for years, however, the LSAT has been in a slow, steady decline. In 2015, I noted several problems—some from LSAC, some from the ABA, some from law schools, some from USNWR—that have resulted in the weakening the value of the LSAT. I followed up in 2017.

In 2019, LSAC entered into a consent decree on a challenge that the analytically reasoning section ran afoul of federal and state accommodations laws. Here’s what LSAC assured:

Additionally, LSAC has begun research and development into alternative ways to assess analytical reasoning skills, as part of a broader review of all question types to determine how the fundamental skills for success in law school can be reliably assessed in ways that offer improved accessibility for all test takers. Consistent with the parties' agreement, LSAC will complete this work within the next four years, which will enable all prospective law school students to take an exam administered by LSAC that does not have the current AR section but continues to assess analytical reasoning abilities.

This week, LSAC announced the conclusion of that project:

The council had four years to replace the logic games with a new analytical reasoning section under the settlement.

Because the analytical and logical reasoning sections test the same skills, it made sense to drop analytical reasoning altogether, council president Kellye Testy said in an interview Wednesday.

"This decision might help some, and it hurts none," Testy said. "The skills that we assess are the same and the scoring is the same."

In the Wednesday email to law school admissions officials, the council said removing analytical reasoning and replacing it with a second section of logical reasoning had “virtually no impact on overall scoring” based on a review of more than 218,000 exams. The revised format was also as effective as the current one in predicting first-year law school grades, the council said.

This is a remarkable conclusion for multiple reasons. First, LSAC opted not to find an “alternative,” as it originally attempted, but simply concluded it could fall back on the existing questions. Second, its conclusions run afoul of its own technical report from 25 years ago.

We shall see the LSAC new technical report, whenever it is released, as to how it the analytical reasoning section had “virtually no impact” on scoring and was “as effective” in predicting grades.

But from the existing LSAC literature, the decision to drop the analytical section will make the LSAT worse. It’s also not clear the many confounding variables that have made the LSAT worse over the years are diluting the “effectiveness” of the LSAT in its predictive power, which makes further modifications all the more marginal in terms of the effect it may have.

The hesitation I have in the title of this post, “appears,” is that I’m willing to see what LSAC puts out to explain how its 1998 study comports with its 2023 decision. But so far, I’m skeptical.

Which law schools are most aggressively pursuing admissions UGPA and LSAT medians?

I’ve long noted that USNWR’s decision to use the medians for admissions distorts how law schools behave. Law schools pursue medians at the expense of higher-caliber students who may fall just below targeted medians.

We can find ways of measuring just how aggressively law schools pursue medians. The gap from the 50th percentile to the 25th percentile of admissions metrics can show a drop-off, but that’s really only part of the story. A school can have some gap in the 50th and 25th percentiles, but it may also have a gap in the 75th and 50th, suggesting some reasonable spread among incoming students. Instead, what interests me is how close the gap is between the 75th and 50th, compared to the gap between the 50th and 25th.

Suppose a law school has incoming LSAT scores of 165, 160, and 155 as the 75th, 50th, and 25th percentiles. (This is distorted somewhat because there are more 155s than 165s, so it’s a reason I’ll use LSAT percentiles below in a moment.) That would suggest some fair distribution among the class. Suppose instead it’s a 163, 160, 153. You’ll see the median is closer to the 75th percentile, but the 25th percentile drops of somewhat. It would be in line with my explanation of some distortion in admissions—school preferring students who may have a lower LSAT but a higher GPA, which distorts the 25th percentile. Now suppose it’s 162, 160, and 150. We see tight compression at the 75th and 50th percentiles, consistent with awarding merit scholarships to aggressively pursue a target median LSAT; and a big drop-off in scores at the tail end of the class.

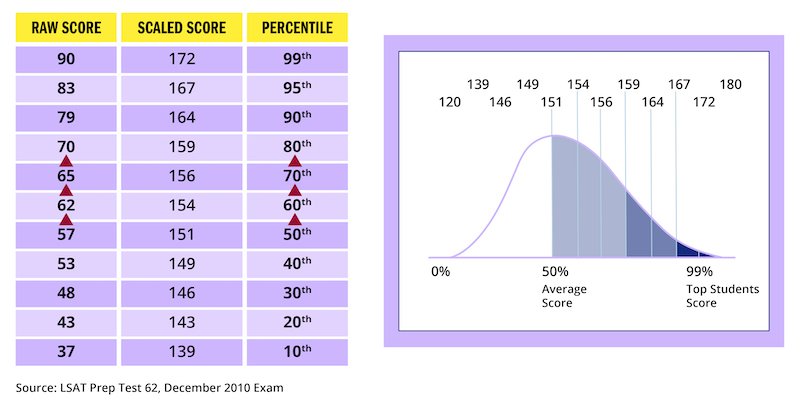
Now, the distribution of LSAT scores is something of a bell curve. The average score is around a 150 on the 120-180 scale. Most scores are clustered in the middle. Fewer and fewer applicants get more and more elite scores. The 155-159 LSAT test score band has around twice as many applicants as the 170-174 band. LSAC application data bears this out. In the 2023 cycle, there were 1661 applicants who had a 155-159 test score. There were 1437 with a 160-164.. That dropps to 1187 for a 165-169. And it’s just 964 with a 170-174, and 365 with a 175-180. This graphic from Kaplan helps show the distribution among scores (a separate way of looking at the data from the applicant profiles):

As I’ve noted elsewhere, a median-chasing strategy is likely to have much lower returns in the future if the new USNWR methodology stays in roughly the same place. Admissions statistics have much lower value. Outputs—including bar passage rate for all of the class, including those students with lower predictors—matter much more. We may see a significant shift in how schools approach admissions. (And that will be an interesting contrast to observe!)

Let’s start with LSAT. The figures below are the difference between the differences of the 75th and 50th percentile LSAT scores and the 50th and 25th percentile LSAT scores (LSAT scores roughly converted to their own percentiles). (I limited this to schools with the top 80 or so overall medians.)

Georgia: 169/168/156, -30.8

St. John’s: 164/162/154, -22.5

Arizona State: 168/167/158, -21.4

Wisconsin: 167/165/157, -19.8

Wayne State: 163/161/154. -19.7

Case Western: 162/160/153, -19.6

Drexel: 161/159/152, -19.4

George Mason: 167/166/158, -19.3

American: 163/162/156, -17.5

Penn State Law: 163/162/156, -17.5

Georgia leads the way—with a 169/168/156, this is really no surprise and maybe one of the more dramatic ones. St. John’s (164/162/154) and Arizona State (168/167/158) are also high on the list.

A few other scores had large numerical LSAT score gaps but were lower on percentile differences. Emory (169/168/ 161, -13.6), Vanderbilt (170/170/163, -12.1), Florida (170/169/162, -12) and Washington University in St. Louis (173/172/164, -10.6) all had gaps of 6 or 7 points in raw scores, but the percentiles of those scores were higher.

I’ll offer a visualization of this one to get a sense of the spread. Note that these LSAT percentiles are approximated, but the LSAT scores are listed to give a sense of the compression of scores near the top of the band.

You can see that these schools have a highly compressed 75th and 50th percentile, and then a large gap to the 25th percentile of the class.

We can also flip the list—which schools have the even distributions (and, for a few schools, closer 50th-25th gaps than 75th-50th)?

Hawaii: 160/156/154, +6.7

Kentucky: 160/157/155, +3.2

Cincinnati: 161/158/156, +2.2

Iowa: 165/163/161, -0.1

Columbia: 175/173/171, -0.3

Texas Tech: 160/157/154, -0.5

Syracuse: 160/157/154, -0.5

Cornell: 174/172/170, -0.5

Loyola-Chicago: 161/159/157, -0.6

Stanford: 176/173/170, -0.9

Schools like Columbia, Cornell, and Stanford are impressive on this front (and Yale is 11th on the list at -1.3) for having such close distributions from the 75th to the 25th, despite how few students have such high LSAT scores.

When we visualize it, we can see how much more evenly distributed the classes are from top to bottom:

You can see the stark contrast among these schools to the schools above.

Over to UGPA:

Washington University in St. Louis: 4.0/3.94/3.43, -0.45

Arizona State: 3.94/3.85/3.42, -0.34

Texas A&M: 3.98/3.93/3.54, -0.34

Wayne State: 3.89/3.8/3.38, -0.33

Florida: 3.97/3.9/3.52, -0.31

Richmond: 3.87/3.75/3.33, -0.3

Drexel: 3.82/3.72/3.33, -0.29

Indiana-Bloomington: 3.92/3.81/3.42, -0.28

George Mason: 3.93/3.83/3.45, -0.28

Chapman: 3.78/3.63/3.2, -0.28

Three schools (Arizona State, Wayne State, and George Mason) make both lists. (As noted, Washington University in St. Louis and the University of Florida have fairly large LSAT spreads, but that did not translate to percentile differences.)

Now on the flip side, most balanced incoming class based on UGPA metrics:

Iowa: 3.83/3.66/3.49, 0

Mississippi: 3.81/3.54/3.27, 0

Stanford: 3.99/3.92/3.84, -0.01

Oregon: 3.76/3.57/3.37, -0.01

Stetson: 3.73/3.51/3.28, -0.01

Columbia: 3.95/3.87/3.78, -0.01

Yale: 3.99/3.94/3.87, -0.02

Berkeley: 3.9/3.83/3.74, -0.02

Cincinnati: 3.91/3.73/3.52, -0.03

Loyola-Chicago: 3.72/3.56/3.37, -0.03

Harvard: 3.99/3.92/3.82, -0.03

Duke: 3.84/3.85/3.73, -0.03

We see some of the same schools (Cincinnati, Columbia, Iowa, Loyola-Chicago) make both lists here, too.

It’s pretty stark to see some of the disparities in the gaps of how UGPA percentiles fill out a class. Washington University (4.0/3.94/3.43) has a higher 50th percentile than Iowa’s (3.83/3.66/3.49) 75th percentile, but it has a lower 25th percentile.

Recall, the metric here is not about the “best” or “worst” schools. It’s meant simply to display the disparities in how schools treat the delta between the 75th and 50th percentiles, and the 50th and 25th percentiles, in their incoming classes.

There’s no question that schools have widely divergent approaches to “chasing” the median. Some schools are much more aggressive, on one or both metrics, than others. And others are much more aggressive about ensuring “balance” in the class—it’s doubtful that schools with fairly “balanced” classes on both metrics get there by accident. Those more balanced classes (especially on the LSAT metric) are more likely (contingent on many other factors) to see more long-term success on the bar exam, relatively speaking. But there are many other factors at play that complicate this. And many other factors that could affect matters like academic dismissals, scholarship retention, employment outcomes, and the like.

It will be illuminating to see if the median “chasing” diminishes in light of new rankings metrics. But it’s certainly something I’m watching.

USNWR incorporates faculty citations, graduate salary, debt data into its college metrics--will law schools be next?

USNWR has many rankings apart from its graduate school (and specifically law school) rankings, of course. (One of my favorites is its ranking of diets.) Its collegiate rankings have been around for a long time and have been influential, and because it is a higher education ranking, it is useful to see what USNWR is doing with it in case it portends future changes elsewhere.

USNWR has bifurcated some of its methodology. For “national universities,” it uses some different factors from other schools it ranks. (Law schools are all ranked together in one lump.) And this year included three notable changes in some or all of the rankings—notable, for this blog’s purposes.

First, debt.

Borrower debt: This assesses each school's typical average accumulated federal loan debt among only borrowers who graduated. It was sourced from the College Scorecard, a portal of higher education data administered by the U.S. Department of Education.

. . .

In previous editions, the data was sourced from U.S. News' financial aid surveys and assessed mean debt instead of median debt. There are two reasons behind this change. One is that 50th percentile amounts are more representative than average amounts because they are less impacted by outliers. The other is that College Scorecard's data is sourced from its department's National Student Loan Data System (NSLDS), which keeps records of federal loan disbursements and therefore is a more direct source of information than school-reported data.

As readers of this blog know, I’ve long used similar metrics for law schools on this blog and have found them useful. And readers may recall that USNWR used to collect debt data; incorporated it in the last two years’ of rankings; and then stopped this year with the rise of the “boycott.” Law schools stopped voluntarily reporting indebtedness. So USNWR dropped it for only publicly available information.

The College Scorecard is publicly available. It offers this debt data for USNWR to use. Will USNWR incorporate it in next year’s rankings? It remains a distinct possibility, as the note above suggests.

Second, citations.

To be grouped in the National Universities ranking, an institution must be classified in the Carnegie Classifications as awarding doctorate-level degrees and conducting at least "moderate research." In alignment with these schools' missions, U.S. News introduced four new faculty research ranking factors based on bibliometric data in partnership with Elsevier. Although research is much less integral to undergraduate than graduate education – which is why these factors only contribute 4% in total to the ranking formula – undergraduates at universities can sometimes take advantage of departmental research opportunities, especially in upper-division classes. But even students not directly involved in research may still benefit by being taught by highly distinguished instructors. Also, the use of bibliometric data to measure faculty performance is well established in the field of academic research as a way to compare schools.

Only scaled factors were used so that the rankings measure the strength and impact of schools' professors on an individual level instead of the size of the university. However, universities with fewer than 5,000 total publications over five years were discounted on a sliding scale to reduce outliers based on small cohort sizes, and to require a minimum quantity of research to score well on the factors. The four ranking factors below reflect a five-year window from 2018-2022 to account for year-to-year volatility.

Citations per publication is total citations divided by total publications. This is the average number of citations a university’s publications received. The metrics are extracted from SciVal based on Elsevier’s Scopus® Data.

Fields weighted citation impact is citation impact per paper, normalized for field. This means a school receives more credit for its citations when in fields of study that are less widely cited overall. The metrics are extracted from SciVal based on Elsevier’s Scopus® Data.

The share of publications cited in the top 5% of the most cited journals. The metrics are extracted from SciVal based on Elsevier’s Scopus® Data.

The share of publications cited in the top 25% of the most cited journals. The metrics are extracted from SciVal based on Elsevier’s Scopus® Data.

Each factor is calculated for the entire university. The minority of universities with no data on record for an indicator were treated as 0s. The Elsevier Research Metrics Guidebook has detailed explanations of the four indicators used.

Elsevier, a global leader in information and analytics, helps researchers and health care professionals advance science and improve health outcomes for the benefit of society. It does this by facilitating insights and critical decision-making for customers across the global research and health ecosystems. To learn more, visit its website.

USNWR had considered using citation metrics from Hein for law school rankings years ago. I tried to game it out to show how it may not change much, as it was fairly closely related to overall peer score, but that it could affect how the overall rankings look because of the gap in citation metrics as opposed to peer score. But like Hein, here USNWR outsourced the citations to Elsevier’s Scopus.

I do not know if USNWR would choose to use Scopus (which has a much smaller set of legal citations than other databases. (I believe Scopus records less than 10% of the citations that Westlaw and Google Scholar have for my work, as one example.) But USNWR’s willingness to engage with scholarship for national universities suggests it might consider doing the same for law schools. Of course, law schools are ranked together, as opposed to “research” law schools and “teaching” law schools, for lack of better terms here.

Third, salaries.

College grads earning more than a high school grad (new): This assesses the proportion of a school's federal loan recipients who in 2019-2020 – four years since completing their undergraduate degrees – were earning more than the median salary of a 25-to-34-year-old whose highest level of education is high school.

The statistic was computed and reported by the College Scorecard, which incorporated earnings data from the U.S. Department of the Treasury. Earnings are defined as the sum of wages and deferred compensation from all W-2 forms received for each individual, plus self-employment earnings from Schedule SE. The College Scorecard documented that the median wage of workers ages 25-34 that self-identify as high school graduates was $32,000 in 2021 dollars. The vast majority of jobs utilizing a college degree, even including those not chosen for being in high-paying fields, exceed this threshold.

The data only pertained to college graduates and high school graduates employed in the workforce, meaning nongraduates, or graduates who four years later were continuing their education or simply not in the workforce, did not help or hurt any school.

U.S. News assigned a perfect score for the small minority of schools where at least 90% of graduates achieved the earnings threshold. Remaining schools were assessed on how close they came to 90%. The cap was chosen to allow for a small proportion of graduates to elect low-paying jobs without negatively impacting a school's ranking.

The ranking factor's 5% weight in the overall ranking formula equals the weight for borrower debt, because both earnings and debt are meaningful post-graduate outcomes.

This is something like the flip side of the debt question, which I’ve also written about, again from publicly available data. And it would solve some of the problems that USNWR has in conflating a lot of job categories into one, or weighting them by some arbitrary percentages.

All three are fairly interesting—and, might I say, on the whole, good—additions to the collegiate rankings. Yes, like with any metric, one can quibble about the weights given to them, and how any factors can be gamed.

But I am watching closely now to see how USNWR might incorporate factors like these in its next round of law school rankings. If that’s true, these projected rankings I offered this spring aren’t worth much.
USNWR should considering incorporating conditional scholarship statistics into its new methodology

Earlier, I blogged about how USNWR should considering incorporating academic attrition into its methodology. Another publicly-available piece of data that would redound to the benefit of students would be conditional scholarship statistics.

Law students offer significant “merit based” aid—that is, based mostly on LSAT and UGPA figures of incoming students. The higher the stats, the higher the award in an effort to attract the highest caliber students to an institution. They also offer significant awards to students who are above the targeted medians of an incoming class, which feeds back into the USNWR rankings.

Law schools will sometimes “condition” those merit-based awards on law school performance, a “stipulation” in order to retain the scholarship in the second and third years of law school. The failure to meet the “stipulation” means the loss or reduction of one’s scholarship—and it means the student must pay the sticker price for the second and third years of law school, or at least a higher price than the students had anticipated based on the original award.

The most basic (and understandable) condition is that a student must remain in “academic good standing,” which at most schools is a pretty low GPA closely tied to academic dismissal (and at most schools, academic dismissal rates are at or near zero).

But the ABA disclosure is something different: “A conditional scholarship is any financial aid award, the retention of which is dependent upon the student maintaining a minimum grade point average or class standing, other than that ordinarily required to remain in good academic standing.”

About two-thirds of law schools in the most recent ABA disclosures report that they had zero reduced or eliminated scholarships for the 2019-2020 school year. 64 schools reported some number of reduced or eliminated scholarships, and the figures are often quite high. If a school gives many awards but requires students to be in the top half or top third of the class, it can be quite challenging for all awardees to maintain their place. One bad grade or rough day during exams in a point of huge compression of GPAs in a law school class can mean literally tens of thousands of dollars in new debt.

Below is a chart of the reported data from schools about their conditional scholarship and where they fall. The chart is sorted by USNWR “peer score.” (Recall all the dots at the bottom are the 133 schools that reported zero reduced or eliminated scholarships.)

These percentages are the percentage of all students, not just of scholarship recipients—it’s meant to reflect the percentage among the incoming student body as a whole (even those without scholarships) to offer some better comparisons across schools. (Limiting the data to only students who received scholarships would make these percentages higher.)

It would be a useful point of information for prospective law students to know the likelihood that their scholarship award will be reduced or eliminated. (That said, prospective students likely have biases that make them believe they will “beat the odds” and not be one of the students who faces a reduced or eliminated scholarship.)

A justification for conditional scholarships goes something like this: “We are recruiting you because we believe you will be an outstanding member of the class, and this merit award is in anticipation of your outstanding performance. If you are unable to achieve that performance, then we will reduce the award.”

I’m not sure that’s really what merit-based awards are about. They are principally about capturing high-end students, yes, for their incoming metrics (including LSAT and UGPA). It is not, essentially, a “bet” that these students will end up at the top of the class (and, in fact, is a bit odd to award them cash for future law school performance). If this were truly the motivation, then schools should really award scholarships after the first year to high-performing students (who, it should be noted, would be, at that time, the least in need of scholarship aid, as they would have the best employment prospects).

But it does allow schools to quietly expand their scholarship budget, at the expense of current students. Suppose a school has a $5 million annual scholarship budget. That should work out to $15 million a year (three years of students at a school at any one time). But if 20% of scholarships are eliminated, that budget can drop to $13 million.

I find it difficult to justify conditional scholarships (and it is likely a reason why the ABA began tracking and publicly disclosing the data for law students). I think the principal reason for them is to attract students for admissions purposes, not to anticipate that they will perform. And while other student debt metrics have been eliminated from the methodology because they are not publicly available, this metric has some proxy to debt and has some value for prospective students. Including the metric could also dissuade the practice at law schools and provide more stable pricing expectations for students.