Two charts on non-JD law school enrollment figures for 2014
Following up on last week's post on non-JD enrollment, I thought I would update last year's charts on the ratio of JD and non-JD enrollment in law schools.
The first update reflects the last 26 years of non-JD enrollment as a percentage of law school enrollment, updated to include the 2013-2014 figures.
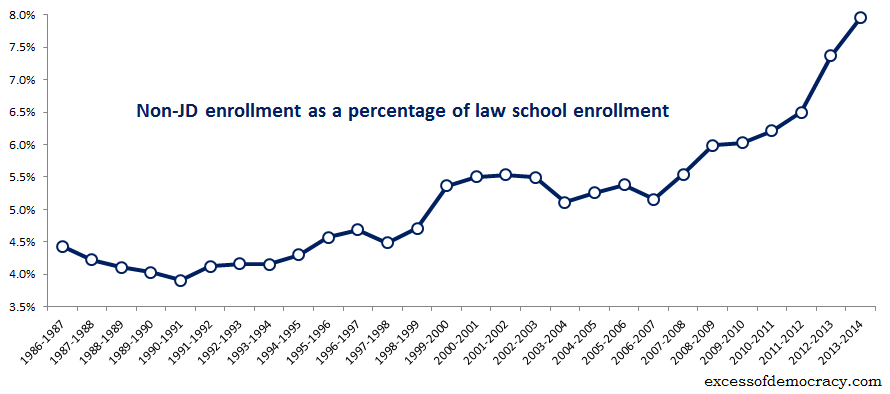
Non-JD enrollment was in the 4-5% range until around 2000, when it increased to around 5-5.5% for the next few years, and has risen each year since 2007. In the 2008-2009 and 2009-2010 academic years, non-JD students were 6% of all law school enrollment. In 2010-2011, it was 6.2%; in 2011-2012, it was 6.5%; and in 2012-2013, it was 7.4%. This year, it increased yet again to 8.0%.
Part of that recent increase is, of course, relative. The non-JD percentage appears higher in the last three academic years in particular simply because of the significant drop-off in JD enrollment. But it's also higher in absolute terms, too. Consider the last 11 years.

When I drafted this chart last year, I tried to make the scale the same on both sides, with a common starting point for the JD enrollment (blue, on the left axis) and the non-JD enrollment (red, on the right axis), to reflect changes in absolute numbers. That, however, yielded an uncomfortable chart when I updated it. The sharp drop in JD enrollment means that the non-JD axis of the chart technically dips below zero (denoted by a small line below the last numbered axis point). But I wanted to preserve the same chart I used last year for continuity.