Which Supreme Court justices are the topic of the most academic articles?

A recent draft article about Justice Kennedy's influence and legacy sparked a social media discussion about which justices attract the most academic attention.

I looked at the Westlaw database and searched for "ti(justice /2 [lastname])." The "ti()" field is slightly broader than just looking at the title of the article alone, but for this purpose it captured almost exclusively articles with a justice's name in the title. I didn't distinguish between Chief Justice Rehnquist's time as an Associate Justice (with that title), but I added a "chief" to my Roberts search to separate out hits for Justice Owen Roberts (there was at least one...). This search also would typically remove results for "the Rehnquist Court" or "the Roberts Court," which are less about the chief justices in particular, but it may slightly undercapture articles about those two justices. UPDATE: This methodology somewhat undercaptures references to justices that are more colloquial (e.g., use just the last name without the title "justice") or include the justice's name as an author without a title in a book review, but it eliminates far more false positives for most other justices who have more common names than "Scalia," "Alito," and "Sotomayor."

I imagine there might also a logarithmic effect one might observe--or expect to observe--over the course of a justice's career. As a justice begins, few, if any, articles will be written about her; as her influence increases over time, we would expect to see more articles each year than the previous year. (There may also be separate bursts of scholarship around a justice's retirement and around a justice's death.) This metric is static and treats each year as the same--perhaps someone would spend more time analyzing year-by-year impact! Additionally, the increase in the volume of journals, particularly online journals available on Westlaw, may skew results for justices with more recent histories.

I narrowed my search to the "Law Reviews & Journals" database, which is broad enough to include some practitioners' publications and the ABA Journal but should work for a rough examination of justices. I then developed a charge, "Law Journal Article Title Mentions Per Year," with the denominator the years since that justice first joined the Supreme Court. I selected all of the most recent 13 justices (excluding Justice Gorsuch) to have served on the Court.

UPDATE: I transposed the dates for Justices Sotomayor and Kagan in an earlier version, and their data changed slightly.

I then added in Justice Gorsuch and looked simply at the raw citation totals, regardless of years' services.

I'll leave it to others to discern what these figures might mean, if anything. I'll note that Justice Scalia dwarfs all others, which was not surprising, but a few other results did mildly surprise me. A few pieces about Justice Gorsuch were apparently written in his days as a prospective, or actual, nominee, then converted into pieces with a title about what "Justice Gorsuch," rather than "Judge Gorsuch," has written or said in the past--one reason his number is at 5 after one years' service, to Justice Kagan's 4.

UPDATE: Dave Hoffman rightly points out that there are likely tens of thousands of law journal articles published every single year. Due to the search function in Westlaw, I could not even limit a search of articles mentioning "law" in a given year, because results cannot exceeds 10,000 hits, and I can't narrow the search database to Law Reviews & Journals in WestlawNext. Articles about a Supreme Court justice, then, are a tiny slice of all scholarship. UPDATE: And, of course, this is only a very crude metric that is assuredly overinclusive and underinclusive. But, the relative relationships between justices should be modestly illuminating.

Recent trends in non-JD legal education

I've blogged before about the rise of non-JD legal education. Law schools increasingly rely on non-JD sources of revenue (now, 1 in 9 students enrolled in a law school are not a part of the JD program, up sharply over the last few years). I've also expressed some concern about the value proposition of some of those degrees, particularly given the high failure rate of LLM graduates on the bar exam.

I thought I'd share a prediction, an update, and a new observation.

First, I predict that non-JD enrollment will drop this year, the first such decline in some time. I suggested last year that the new presidential administration might lead to declines in foreign visitors to American educational institutions. I anticipate that will be true when it comes to non-JD education (and foreign students are a significant portion of such degree offerings). Even though the "Travel Ban 1.0/2.0/3.0" has been ostensibly limited in scope and had significant legal challenges (in addition to naturally-expiring deadlines), I think these formal legal postures are quite distinct from the pragmatic effect that even the rhetoric about such immigration restrictions would have on prospective foreign students. We should know more next month.

Second, the New York bar is by far the most popular bar exam for foreign attorneys. This year, first-time test-takers from foreign countries had a whopping 57% pass rate, dramatically up from the historic 42%-46% pass rate in recent years. I don't know what would cause such an increase--more student from English-speaking countries; better bar prep; or any of a number of factors. But it's worth noting in light of my earlier concerns about the low bar pass rates. (The same kind of improvement took place in Texas: first-time pass rates among July test-takers rose from 20% in 2015 and 25% in 2016 to 44% in 2017.) Not all have secured a US non-JD degree, but many do as a prerequisite to taking a state bar exam.

nonjdonlinevtradenrollment.png

Third, law schools have discovered online non-JD legal education. It's not clear how such degrees fit into the overall marketplace (any more so than non-JD degrees more generally), and it might be that such opportunities will offset at least some of the loss of other non-JD enrollment.

Indeed, breaking down traditional versus online non-JD enrollment in the last few years, online non-JD enrollment is up significantly, and traditional non-JD enrollment has flattened. Much of the most recent growth, then, has come from online non-JD degrees. While online non-JD degrees had enrollment of just 1590 in 2014, it nearly doubled to 2971 in 2016--and I expect is still larger for Fall 2017.

Only 38 schools had online non-JD programs in Fall 2016, but even that figure is deceiving. An eclectic crop of eight schools accounted for about half of all non-JD enrollment in 2016.

nonjdonlineenrollment.png

Again, the Fall 2017 figures will be released soon, and we'll see what changes to these trends have taken place. I remain interested to know the place of non-JD degrees and the future trends of enrollment, and I'll always happily report more updates here.

Bar exam scores rebound to highest point since 2013

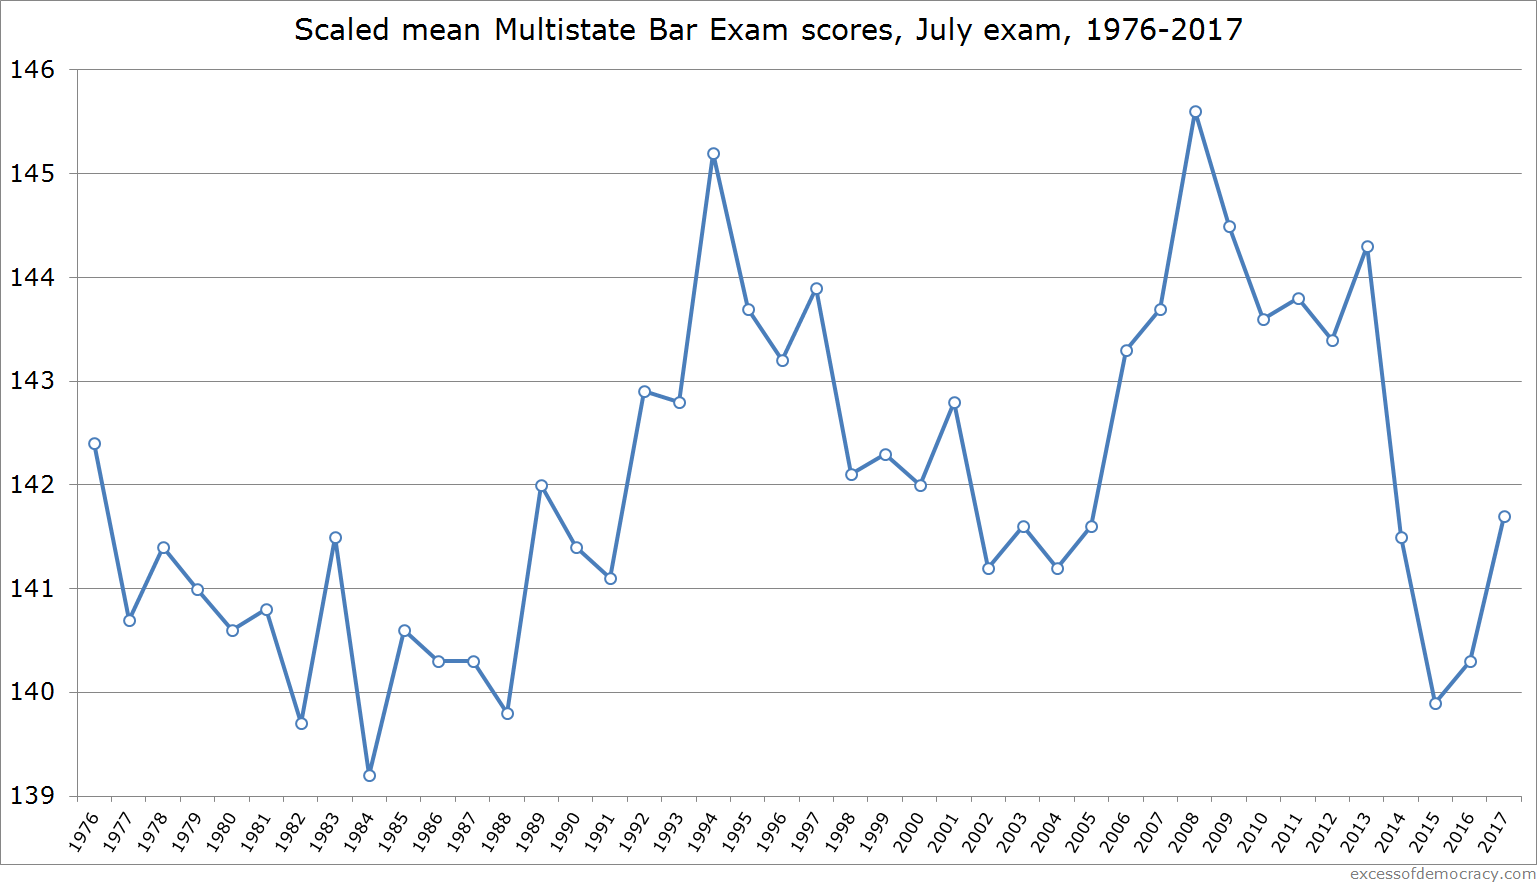
After last year's slight year-over-year improvement in bar exam scores, bar exam scores are up again. The scaled mean of the Multistate Bar Exam rose 1.4 points to 141.7, the highest since 2013, which was 144.3, shortly before a hasty collapse in scores. (The MBE score is a good indicator of bar pass rates to come nationwide, but it's hardly a perfect indicator in every jurisdiction.)

scaledmbescores2017.png

For perspective, California's "cut score" is 144, Virginia 140, Texas 135, New York 133. A bar score of 141.7 is comparable to 2014 (141.5), 2005 (141.6), and 2003 (141.6) in recent years.

This is good news for test-takers and law schools--perhaps the qualifications of students have rebounded a bit as schools improved their incoming classes a few years ago; perhaps students are putting more effort into the bar than previous years; or other factors. We should see a modest rise in pass rates in most jurisdictions, comparable to where they were three years ago.

Note: I chose a non-zero Y-axis to show relative performance.

Visualizing law school federal judicial clerkship placement, 2014-2016

The release of the latest ABA employment data offers an opportunity to update the three-year federal judicial clerkship placement rates. Here is the clerkship placement rate for the Classes of 2014, 2015, and 2016. Methodology and observations below the interactive visualization. The "placement" is the three-year total placement; the "percentage" is the three-year placement divided by the three-year graduating class total.

The placement is based on graduates reported as having a full-time, long-term federal clerkship. (A one-year term clerkship counts for this category.) I thought a three-year average for clerkships (over 3600 clerks from the graduating classes of 2014, 2015, and 2016) would be a useful metric to smooth out any one-year outliers. It does not include clerkships obtained by students after graduation; it only includes clerkships obtained by each year's graduating class.

I included some schools that had only one or two year's worth of data, like the separate Penn State schools. Additionally, I merged the entries for William Mitchell and Hamline into Mitchell|Hamline. The three schools in Puerto Rico are excluded.

I should add that we've actually seen a slight decline in graduates placed into federal clerkships, just under 1200 for the second year in a row. Given last year's figures, some might think this is a trend toward judges hiring more clerks with work experience. I'm not sure that's the case. Instead, I would venture to guess that because the Senate last confirmed a federal judge in November 2015, we may be experiencing an unusual number of vacancies--and, therefore, lack of slots for clerkship hires. In the event the President nominates, and Congress confirms, these judges, we could see a few hundred more clerkship openings in the near future. And if Congress chooses to create more judgeships consistent with the recommendations of the Federal Judicial Center, we'd see even more.

I'll highlight two smaller charts first. The first is New York law school placement.

School Pct Total Clerks
Cornell University 6.5% 36
New York University 5.8% 84
Columbia University 5.0% 64
Brooklyn Law School 2.4% 26
Fordham University 2.0% 25
Syracuse University 1.8% 10
University of Buffalo-SUNY 1.2% 7
St. John's University 1.2% 9
Cardozo School of Law 1.2% 13
Albany Law School 1.1% 6
City University of New York 1.1% 4
Pace University 0.7% 4
New York Law School 0.7% 8
Hofstra University 0.7% 6
Touro College 0.0% 0

The second is California law school placement.

School Pct Total Clerks
Stanford University 27.1% 153
University of California-Irvine 12.5% 40
University of California-Berkeley 12.3% 110
University of California-Los Angeles 4.0% 39
Pepperdine University 3.5% 20
University of Southern California 2.9% 18
University of California-Davis 2.8% 14
Loyola Law School-Los Angeles 2.3% 26
University of San Diego 2.0% 15
University of California-Hastings 1.7% 17
Thomas Jefferson School of Law 0.7% 5
California Western School of Law 0.6% 4
McGeorge School of Law 0.4% 2
Chapman University 0.2% 1
University of San Francisco 0.2% 1
Southwestern Law School 0.1% 1
University of La Verne 0.0% 0
Western State College of Law 0.0% 0
Golden Gate University 0.0% 0
Whittier Law School 0.0% 0
Santa Clara University 0.0% 0

An overall raw chart is below.

St School Pct Total Clerks
CT Yale University 31.0% 200
CA Stanford University 27.1% 153
MA Harvard University 17.6% 312
IL University of Chicago 15.8% 98
VA University of Virginia 15.2% 159
NC Duke University 12.7% 82
CA University of California-Irvine 12.5% 40
CA University of California-Berkeley 12.3% 110
MI University of Michigan 11.1% 119
TN Vanderbilt University 10.3% 58
PA University of Pennsylvania 9.8% 77
TX University of Texas at Austin 9.4% 100
IL Northwestern University 8.0% 66
AL University of Alabama 7.6% 35
MT University of Montana 7.5% 18
IN University of Notre Dame 7.0% 37
LA Tulane University 6.6% 45
KY University of Kentucky 6.5% 26
NY Cornell University 6.5% 36
VA Washington and Lee University 6.1% 24
IA University of Iowa 5.9% 25
VA William and Mary Law School 5.8% 36
NY New York University 5.8% 84
GA University of Georgia 5.8% 36
NC University of North Carolina 5.7% 40
VA University of Richmond 5.5% 25
NY Columbia University 5.0% 64
TX Baylor University 5.0% 20
MN University of Minnesota 4.9% 37
PA Temple University 4.8% 34
MO Washington University 4.5% 32
MS University of Mississippi 4.3% 19
DC Georgetown University 4.1% 81
AR University of Arkansas, Fayetteville 4.1% 15
UT Brigham Young University 4.1% 17
WA University of Washington 4.0% 22
CA University of California-Los Angeles 4.0% 39
WV West Virginia University 3.8% 14
UT University of Utah 3.8% 14
GA Mercer University 3.8% 16
DC George Washington University 3.7% 59
DC American University 3.7% 49
GA Emory University 3.6% 31
KS University of Kansas 3.6% 13
IL University of Illinois 3.6% 19
CA Pepperdine University 3.5% 20
MO University of Missouri 3.4% 13
MA Boston College 3.3% 25
WY University of Wyoming 3.3% 7
VA Regent University 3.0% 10
SD University of South Dakota 3.0% 6
TX Texas Tech University 3.0% 18
TN University of Memphis 2.9% 10
NC Wake Forest University 2.9% 15
CA University of Southern California 2.9% 18
CA University of California-Davis 2.8% 14
PA Pennsylvania State University 2.8% 5
GA Atlanta John Marshall Savannah 2.8% 1
MS Mississippi College 2.7% 12
MD University of Maryland 2.7% 21
GA Georgia State University 2.7% 16
IN Indiana University - Bloomington 2.6% 16
TX Southern Methodist University 2.6% 19
NV University of Nevada - Las Vegas 2.6% 10
VA George Mason University 2.6% 12
LA Louisiana State University 2.6% 15
SC University of South Carolina 2.5% 15
KY University of Louisville 2.5% 9
OH Ohio State University 2.5% 14
AZ University of Arizona 2.4% 10
FL Florida State University 2.4% 17
NY Brooklyn Law School 2.4% 26
LA Loyola University-New Orleans 2.4% 15
NE Creighton University 2.4% 9
ME University of Maine 2.4% 6
CA Loyola Law School-Los Angeles 2.3% 26
TN University of Tennessee 2.3% 10
CT University of Connecticut 2.2% 11
OH University of Toledo 2.2% 7
DC Howard University 2.2% 8
CO University of Colorado 2.2% 11
FL University of Florida 2.1% 20
CA University of San Diego 2.0% 15
PA Widener-Commonwealth 2.0% 5
NY Fordham University 2.0% 25
WI University of Wisconsin 1.9% 12
AZ Arizona State University 1.8% 11
NY Syracuse University 1.8% 10
NJ Rutgers Law School 1.8% 22
OH Case Western Reserve University 1.7% 7
CA University of California-Hastings 1.7% 17
NE University of Nebraska 1.7% 6
OR Lewis and Clark College 1.6% 10
WI Marquette University 1.6% 10
NM University of New Mexico 1.5% 5
NC Elon University 1.5% 4
OH University of Cincinnati 1.5% 5
TX University of Houston 1.4% 10
MO University of Missouri-Kansas City 1.3% 6
AR University of Arkansas, Little Rock 1.3% 5
OH Ohio Northern University 1.3% 3
ND University of North Dakota 1.3% 3
NJ Seton Hall University 1.3% 8
AL Samford University 1.2% 5
IL Southern Illinois University-Carbondale 1.2% 4
NC Campbell University 1.2% 5
NY University of Buffalo-SUNY 1.2% 7
NY St. John's University 1.2% 9
KY Northern Kentucky University 1.2% 5
NY Cardozo School of Law 1.2% 13
MA Boston University 1.2% 8
PA University of Pittsburgh 1.2% 7
PA Villanova University 1.2% 7
TX Texas Southern University 1.1% 5
OK University of Oklahoma 1.1% 5
NY Albany Law School 1.1% 6
PA Penn State - Dickinson Law 1.1% 1
NY City University of New York 1.1% 4
OK University of Tulsa 1.1% 3
MA Northeastern University 1.1% 6
SC Charleston School of Law 1.1% 5
PA Penn State Law 1.0% 2
FL Stetson University 1.0% 9
VA Liberty University 1.0% 2
MI Michigan State University 1.0% 9
WA Gonzaga University 1.0% 4
PA Drexel University 1.0% 4
MI Wayne State University 0.9% 4
OR University of Oregon 0.9% 4
ID University of Idaho 0.9% 3
FL University of Miami 0.9% 10
NY Pace University 0.7% 4
NY New York Law School 0.7% 8
NH University of New Hampshire 0.7% 2
NY Hofstra University 0.7% 6
VT Vermont Law School 0.7% 3
PA Duquesne University 0.7% 3
IL Loyola University-Chicago 0.7% 5
FL Florida A&M University 0.7% 3
CA Thomas Jefferson School of Law 0.7% 5
MO Saint Louis University 0.7% 4
IN Valparaiso University 0.6% 3
CA California Western School of Law 0.6% 4
IL John Marshall Law School 0.6% 7
OH University of Dayton 0.6% 2
TN Belmont University 0.6% 1
WA Seattle University 0.6% 5
CO University of Denver 0.6% 5
TX St. Mary's University 0.6% 4
IA Drake University 0.6% 2
OH Cleveland State University 0.5% 2
DE Widener University-Delaware 0.5% 3
MN University of St. Thomas (Minnesota) 0.5% 2
OH University of Akron 0.5% 2
IL Chicago-Kent College of Law-IIT 0.5% 4
TX South Texas College of Law 0.5% 5
AZ Arizona Summit Law School 0.5% 4
DC Catholic University of America 0.4% 2
AL Faulkner University 0.4% 1
IL Depaul University 0.4% 3
FL Ave Maria School of Law 0.4% 1
LA Southern University 0.4% 2
CA McGeorge School of Law 0.4% 2
MD University of Baltimore 0.3% 3
IL Northern Illinois University 0.3% 1
FL St. Thomas University (Florida) 0.3% 2
TX Texas A&M University 0.3% 2
KS Washburn University 0.3% 1
IN Indiana University - Indianapolis 0.3% 2
CA Chapman University 0.2% 1
OK Oklahoma City University 0.2% 1
MA Suffolk University 0.2% 3
MI University of Detroit Mercy 0.2% 1
NC North Carolina Central University 0.2% 1
CA University of San Francisco 0.2% 1
MN Mitchell|Hamline 0.2% 2
FL Barry University 0.1% 1
FL Nova Southeastern University 0.1% 1
MA New England Law | Boston 0.1% 1
CA Southwestern Law School 0.1% 1
NC Charlotte School of Law 0.1% 1
TN Lincoln Memorial 0.0% 0
ID Concordia Law School 0.0% 0
VA Appalachian School of Law 0.0% 0
CA University of La Verne 0.0% 0
MA University of Massachusetts Dartmouth 0.0% 0
CT Quinnipiac University 0.0% 0
HI University of Hawaii 0.0% 0
RI Roger Williams University 0.0% 0
CA Western State College of Law 0.0% 0
DC District of Columbia 0.0% 0
MA Western New England University 0.0% 0
CA Golden Gate University 0.0% 0
OR Willamette University 0.0% 0
OH Capital University 0.0% 0
CA Whittier Law School 0.0% 0
NY Touro College 0.0% 0
GA Atlanta's John Marshall Law School 0.0% 0
FL Florida International University 0.0% 0
CA Santa Clara University 0.0% 0
FL Florida Coastal School of Law 0.0% 0
MI Thomas M. Colley Law School 0.0% 0

Visualizing legal employment outcomes in DC-Maryland-Virginia in 2016

This is the eighth and last in a series of visualizations on legal employment outcomes for the Class of 2016. Following posts on outcomes in Texas, New York, Illinois, California, Florida, Ohio, and Pennsylvania, here is a visualization for legal employment outcomes of graduates of Pennsylvania law schools for the Class of 2016. (More about the methodology is available at the Texas post.)

Total jobs in unfunded bar passage-required and J.D.-advantage positions increased slightly, counter to much of the rest of the country: there were 2765 positions, up from 2735 last year. 455 J.D.-advantage jobs is more than most markets have, and, as you can see from the chart, can vary fairly significant from school to school. Graduates declined from 3740 to 3602, yielding a fairly strong 79% employment rate. 90 school-funded positions came mostly from two schools, Georgetown (44) and Virginia (19). That leads to some variance in the visualization (sorted by unfunded job placement), and the table below (displaying overall placement, including school-funded positions).

As always, please notify me of any corrections or errata.

Peer score School 2016 YoY% BPR JDA LSF 2015 BPR JDA LSF
4.4 University of Virginia 96.1% 0.7 293 5 19 95.4% 311 9 30
4.1 Georgetown University 87.1% 6.9 486 38 44 80.2% 456 50 38
2.7 George Mason University 86.5% -0.3 86 25 4 86.8% 94 34 4
3.1 Washington & Lee University 84.2% 2.0 73 7 0 82.2% 131 11 1
3.0 University of Maryland 83.6% 8.3 126 51 1 75.3% 156 47 1
3.2 William & Mary Law School 81.3% 5.5 162 21 0 75.8% 118 17 0
3.4 George Washington University 79.8% 1.5 373 61 9 78.3% 301 55 8
2.5 University of Richmond 77.0% 2.8 95 19 0 74.2% 97 21 0
2.1 University of Baltimore 76.2% 2.0 142 69 0 74.2% 142 56 0
1.2 Regent University 70.5% 5.2 57 5 0 65.3% 67 10 0
2.8 American University 66.3% 4.9 219 56 0 61.4% 205 76 4
1.5 District of Columbia 66.0% 14.5 33 30 1 51.5% 15 19 1
2.2 Catholic University of America 65.2% -5.2 53 37 0 70.4% 63 37 0
1.2 Liberty University 63.8% 9.7 32 4 1 54.1% 31 1 1
2.4 Howard University 63.2% 3.7 65 20 1 59.5% 57 12 0
1.2 Appalachian School of Law 52.4% -10.9 15 7 0 63.3% 32 4 2

Perspective on legal employment outcomes for the Class of 2016

The American Bar Association has finally released the employment statistics for the Class of 2016.

I say finally deliberately. Last year, the ABA released them around May 2. The ABA here disclosed them May 11.

In 2013, the ABA approved a change to reporting employment statistics. It used to be "employment outcomes 9 months after graduation," or an employment date of February 15. The ABA moved it back to 10 months for the Class of 2015, or an employment date of March 15. Deans of law schools in New York and California in particular objected that due to late bar exam results (often in November), followed by a holiday season, it was difficult for some students to secure employment by February 15. That artificially depressed employment figures in these jurisdictions compared to the rest of the country.

That pushed back the deadline for schools to report employment outcomes from March 15 to April 15. April is a significant season for prospective law school matriculants. Schools typically have "deposit deadlines" in April, requiring a few hundred dollars' nonrefundable deposit to secure a seat in the class. (I Googled a few: Washington & Lee requires $250 by April 15; Cornell requires $300 by May 1; Georgia requires $150 by April 15; New Mexico requires $200 by April 15.)

It's worth noting that if these employment disclosures are supposed to advance a "consumer protection" rationale (although I'm not sure much has been studied about students' reliance on these disclosures), the decision to move from 9 months to 10 months has undermined some of the "consumer protection" rationale. While most schools have put these results on their websites, several (I'll leave them nameless) have not; the ABA disclosures would be the first release of this information.

Additionally, the putative reason for moving the reporting deadline back a month does not appear to have been borne out. Consider New York & California employment outcomes in the last few years: it's not obvious that the employment situation materially improved after the date change. Granted, some of this is likely attributable to other causes, the peril of isolating one factor among many possible factors. But it would be worth the ABA considering evidence from these law schools that the change did materially improve outcomes in those jurisdictions--evidence we just don't have.

It's also a time to discuss recent predictions about this class. Professor Ted Seto in 2014 offered an optimistic prediction for the Class of 2016: "If the new BLS projections are accurate, we should see demand and supply in relative equilibrium in 2015 and a significant excess of demand over supply beginning in 2016."

Perhaps the BLS data wasn't quite accurate, or perhaps it was an overly-rosy view of what employment might look like. In what's surely a disappointment, nationwide employment in unfunded full-time, long-term, bar passage-required positions has been steadily declining. Placement in such positions was just 22,874, down from 25,787 three years ago. (UPDATE: please note that I excluded Puerto Rico's three law schools from this analysis.)

  Graduates FTLT BPR Placement FTLT JDA
Class of 2012 45,751 25,503 55.7% 4,218
Class of 2013 46,112 25,787 55.9% 4,550
Class of 2014 43,195 25,348 58.7% 4,774
Class of 2015 40,205 23,895 59.4% 4,416
Class of 2016 36,654 22,874 62.4% 3,948

The good outcome is that the percentage of graduates placed has improved as the number of law school graduates has declined sharply. So why a decline in raw jobs? There are many possible reasons, and I only offer a few to speculate here for future investigation.

Some of this is likely attributable to declines in bar passage scores. But perhaps more troubling has been the decline in J.D. advantage positions, too. For years, the versatility and flexibility of J.D. has been a common point of defense among law schools, not without some controversy. But those positions--which not only highlight the versatility of the J.D., but aren't contingent on passing the bar--have been declining, too.

It may be that law schools have too readily assumed the fungibility of a law degree. That is, even if the total number of law school graduates have declined, it may be that employers still prefer individuals who graduate in the top X% of the class, from a top-Y law school. It may be that they have been reluctant to dip lower into classes or to lower-ranked schools. That is, they're not just looking for any law school graduates; they're still looking for a certain quality of graduate, and they may not be convinced that they should move off their previous expectations. Or it may be that BLS or other labor data has simply been too optimistic about the new lawyer market.

Last year, I noted the sharp decline in law school-funded positions. The same is true for this year. Through a combination of changes to reporting requirements (schools must pay at least $40,000 a year), the requirement under the Affordable Care Act that they provide health insurance if they are working more than 30 hours a week, and the USNWR decision to cut the weight of such positions in its methodology, we likely won't see a resurgence in this category anytime soon.

In short, the good news of the employment picture is almost exclusively a result of law school graduating classes shrinking significantly. Raw job placement has grown slightly and steadily worse over the last few years, while the placement rate has ticked up somewhat--7 points of improvement in the last few years.

Visualizing legal employment outcomes in Pennsylvania in 2016

This is the seventh in a series of visualizations on legal employment outcomes for the Class of 2016. Following posts on outcomes in Texas, New York, Illinois, California, Florida, and Ohio, here is a visualization for legal employment outcomes of graduates of Pennsylvania law schools for the Class of 2016. (More about the methodology is available at the Texas post.)

Pennsylvania is new to my series of visualizations. Total jobs in these unfunded bar passage-required and J.D.-advantage positions declined somewhat, from 1077 to 1036. There were about 250 fewer graduates, from 1414 to 1260. As a result of the significant decline in enrollment, overall prospects for graduates improved: the overall employment rate was 82.7% (including all funded positions), up from 76.2% last year.

It's worth noting that some of these schools are quite small: Penn State Dickinson had just 34 graduates; Penn State Law (in State College) had 95; Widener had just 53. The visualization below can look somewhat deceiving. Ideally, the width of the bars would be variable based on the total number of graduates, (larger classes would have thicker bars to display the total grads they placed), but that apparently is not readily available in Excel. I'll look into improving the display for next year. Blogging is constantly a work in progress!

As always, please notify me of any corrections or errata.

Peer Score School 2016 YoY% BPR JDA LSF 2015 BPR JDA LSF
4.3 University of Pennsylvania 97.3% 0.9 230 17 4 96.3% 221 10 6
2.0 Pennsylvania State University - Dickinson Law 88.2% 18.1 28 2 0 70.2% 34 6 0
2.1 Drexel University 83.7% 4.8 111 12 0 78.9% 83 18 0
2.7 Temple University 83.2% 7.7 135 32 1 75.5% 149 42 0
2.4 Villanova University 82.0% 5.9 119 21 1 76.1% 132 29 1
2.3 Penn State Law 74.7% 6.4 63 8 0 68.4% 52 15 0
2.6 University of Pittsburgh 74.3% 6.4 108 22 0 67.9% 105 28 0
1.8 Duquesne University 74.2% 8.7 76 16 0 65.5% 77 18 0
1.6 Widener Commonwealth 67.9% 2.5 26 10 0 65.4% 40 11 0

Visualizing legal employment outcomes in Ohio in 2016

This is the sixth in a series of visualizations on legal employment outcomes for the Class of 2016. Following posts on outcomes in Texas, New York, Illinois, California, and Florida, here is a visualization for legal employment outcomes of graduates of Ohio law schools for the Class of 2016. (More about the methodology is available at the Texas post.)

The total placement rate among the 983 statewide graduates was 69.6%. That's up slightly over last year's 68.5% rate, but gradates dropped significantly from last year's 1089. Total raw placement into unfunded bar passage-required jobs dropped from 594 last year to 539 this year.

As always, please notify me of any corrections or errata.

Peer Score School 2016 YoY% BPR JDA LSF 2015 BPR JDA LSF
3.3 Ohio State University 89.4% 2.5 137 20 3 86.9% 132 19 2
2.4 University of Cincinnati 83.7% 2.9 74 13 0 80.7% 67 21 0
1.7 University of Dayton 72.8% 9.4 40 19 0 63.4% 48 11 0
1.8 Cleveland-Marshall College of Law 67.5% 1.5 62 17 0 66.1% 57 15 0
2.6 Case Western Reserve University 64.6% -6.2 56 8 0 70.8% 86 16 0
1.8 University of Akron 62.9% -0.5 58 20 0 63.4% 73 17 0
1.5 Ohio Northern University 62.5% 11.7 35 10 0 50.8% 26 6 0
1.8 University of Toledo 60.2% -6.4 32 21 0 66.7% 48 21 1
1.5 Capital University 49.6% -4.5 45 14 0 54.1% 57 23 0

Visualizing legal employment outcomes in Florida in 2016

This is the fifth in a series of visualizations on legal employment outcomes for the Class of 2016. Following posts on outcomes in Texas, New York, Illinois, and California, here is a visualization for legal employment outcomes of graduates of Florida law schools for the Class of 2016. (More about the methodology is available at the Texas post.)

Florida Coastal disclosed data this year, and Western Michigan University-Cooley's Tampa campus did not disclose campus-specific data, so it's hard to make year-over-year comparisons in the aggregate. But the total placement rate among the 2479 statewide graduates was 65.4%, without a single school-funded job. (That's down slightly over last year, but Florida Coastal has far more graduates than Cooley's Tampa campus.) The University of Florida, Florida State, and Florida International have almost identical placement, very similar to last year.

As always, please notify me of any corrections or errata.

Peer Score School 2016 YoY% BPR JDA LSF 2015 BPR JDA LSF
3.1 University of Florida 82.4% 0.9 230 36 0 81.5% 232 15 0
1.8 Florida International University 81.7% 0.7 108 17 0 81.0% 97 22 0
3.0 Florida State University 80.4% -1.3 136 16 0 81.7% 183 23 0
2.7 University of Miami 78.6% 7.4 209 45 0 71.2% 257 40 0
2.1 Stetson University 76.5% -3.2 166 59 0 79.7% 171 49 0
1.2 Ave Maria School of Law 60.3% 10.3 36 2 0 50.0% 31 11 1
1.6 Nova Southeastern University 57.7% -6.3 117 21 0 64.0% 173 10 0
1.4 St. Thomas University 52.0% 1.1 97 8 0 50.9% 71 13 0
1.4 Florida A&M University 50.3% 0.0 56 18 0 50.3% 56 18 0
1.2 Barry University 49.8% 1.1 83 40 0 48.7% 80 33 0
1.2 Florida Coastal School of Law 40.5% n/a 108 13 0