Overall legal employment for the Class of 2023 improves slightly, with large law firm and public interest placement growing

That is literally the same headline I had for the class of 2022, but it’s another year of incremental improvement. Outcomes improved incrementally once again. Below are figures for the ABA-disclosed data (excluding Puerto Rico’s three law schools). These are ten-month figures from March 15, 2024 for the Class of 2023.

  Graduates FTLT BPR Placement FTLT JDA
Class of 2012 45,751 25,503 55.7% 4,218
Class of 2013 46,112 25,787 55.9% 4,550
Class of 2014 43,195 25,348 58.7% 4,774
Class of 2015 40,205 23,895 59.4% 4,416
Class of 2016 36,654 22,874 62.4% 3,948
Class of 2017 34,428 23,078 67.0% 3,121
Class of 2018 33,633 23,314 69.3% 3,123
Class of 2019 33,462 24,409 72.9% 2,799
Class of 2020 33,926 24,006 70.8% 2,514
Class of 2021 35,310 26,423 74.8% 3,056
Class of 2022 35,638 27,607 77.5% 2,734
Class of 2023 34,848 27,828 79.9% 2,167

Placement continues to be very good. There was an increase of over a few hundred full-time, long-term bar passage-required jobs year-over-year, and the graduating class size was dipped a bit. Those factors combined for a placement rate of 79.9%. J.D. advantage jobs decreased somewhat, perhaps consistent with a hot law firm market last year.

It’s remarkable to compare the placement rates from the Class of 2012 to the present, from 56% to 80%. And it’s largely attributable to the decline in class size.

Here’s some comparison of the year-over-year categories.

FTLT Class of 2022 Class of 2023 Net Delta
Solo 160 174 14 8.7%
2-10 5,070 4,751 -319 -6.3%
11-25 2,115 2,047 -68 -3.2%
26-50 1,360 1,340 -20 -1.5%
51-100 1,175 1,157 -18 -1.5%
101-205 1,246 1,234 -12 -1.0%
251-500 1,145 1,223 78 6.8%
501+ 6,137 6,360 223 3.6%
Business/Industry 2,797 2,236 -561 -20.1%
Government 3,591 3,766 175 4.9%
Public Interest 2,875 2,991 116 4.0%
Federal Clerk 1,130 1,182 52 4.6%
State Clerk 2,053 2,067 14 0.7%
Academia/Education 375 367 -8 -2.1%

The trend continues a longstanding uptick in public interest placement, which is not an outlier. Public interest job placement is up over 100% since the Class of 2017. These eye-popping number continue to rise. It is likely not an understatement to say that law students are increasingly oriented toward public interest, and that there are ample funding opportunities in public interest work to sustain these graduates. (I include a visualization of the trend of raw placement into these jobs here.)

Sole practitioners continue to slide significantly (they were in the low 300s not long ago in raw placement).

Additionally, large law firm placement continues to boom. Placement is up more than thousands graduates in the last several years. Placement in firms with at least 101 attorneys is around 8800. A full 25% of all law school graduates landed in a “Big Law” firm, and more than 30% of those who were employed in a full-time, long-term, bar passage-required job landed in a “Big Law” firm. (Charts showing both the raw placement and the percentage of graduates are included here in another visualization (charting both on two different axes to see similar trends).

How did law schools and law firms survive the purported “death of Big Law”? Well, Big Law seems to be doing better than ever. It’s not clear we’ll have as hot a market for this year’s class, but it’s something to watch.

One slightly interesting observation is a sharp decline in “business” placement. These tend to be JD advantage positions, and if there’s a decline in JD advantage placement we’d expect to see a decline here, too, but it seems more significant than just JD advantage jobs.

Federal clerkship placement improved a bit but has remained mostly steady.

There’s a lot more to examine in light of USNWR methodology changes, but I’ll save that for another post.

Law school academic dismissal and conditional scholarship eliminations, 2023

Last year, I highlighted the fact that law schools have wide variance in how they handle academic dismissals of first-year law students and how they handle reducing or eliminating scholarships. Both categories, I argued, are negatives for law schools and the kind of information that USNWR could (and perhaps should) incorporate into its rankings. I offered a few ways of comparing schools to one another.

Here’s a visualization of the percentage of first-year law students who were academically dismissed in 2023. These percentages are slightly different than the opaque percentages that are reported to the ABA. These figures look at enrollment as of October 5, 2022; and the ensuing total number of first-year law students who were academically dismissed the following year. The figures exclude transfers, and those who withdrew for other reasons. I organize the chart by USNWR ranking and only look at the top 100 schools.

You can see that most schools have zero or negligible academic attrition, and that it picks up slightly as the chart moves down. But a few schools have somewhat higher academic attrition, 5% or higher.

Now over to scholarship reductions or eliminations. The ABA does not distinguish between the two, or distinguish in the amount. Instead, any reduction or elimination is included. The percentage here is also slightly different than the ABA data—it is the percentage of the overall class in this chart, not the percentage among scholarship recipients. That is, if you did not receive a scholarship, you are included in the denominator in this chart, so this chart includes all 1Ls at each school.

There are far fewer schools that reduce or eliminate scholarships, because the vast majority of school simply do not have “conditional” scholarship policies. But, again, as one moves down the chart, one can see some more reductions or eliminations, with a handful eliminating or reducing scholarships for 10% or more of the class. And there is some overlap among academic attrition rates and conditional scholarship data.

Law school 1L JD hits six-year low, non-JD enrollment trends down

The 2023 law school enrollment figures have been released. They show the a drop in JD enrollment and a drop in non-JD enrollment. About 16% of law school enrollees are not enrolled in a JD program.

For nine of the last 10 years, 1L JD enrollment has been between 37,000 and 38,500, remarkable consistency. In 2021, it hit a recent high of 42,718, but it trended down last year, and again this year, down to 37,886 the lowest since 2017’s 37,398.

Total JD enrollment sits at 116,851, well off the peak of 2010-2011 with 147,525.

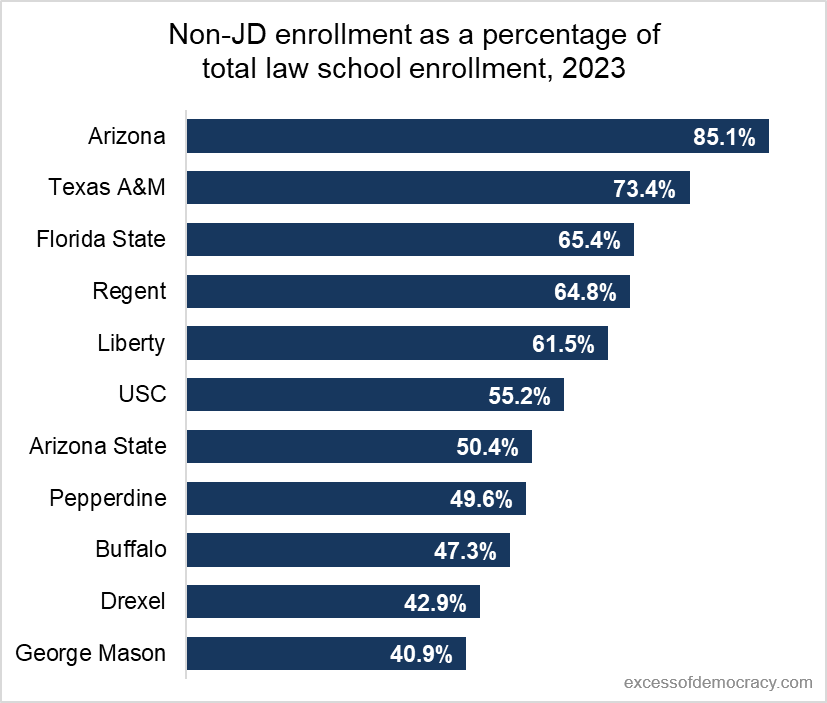
Non-JD enrollment has been more fickle in recent years. It ballooned to more than 24,000 students last year, good for more than 17% of all law school enrollees, but settled down to 21,966, 15.8% of all law school enrollees, and still consistent with recent highs.

Ten schools have at least 40% of their total overall law school enrollment made up of non-JD students in 2023.

Overall legal employment for the Class of 2022 improves slightly, with large law firm and public interest placement growing

The aftermath of a pandemic, bar exam challenges, or a softening economy didn’t dampen the employment outcomes for law school graduates in 2022. Outcomes improved a touch. Below are figures for the ABA-disclosed data (excluding Puerto Rico’s three law schools). These are ten-month figures from March 15, 2023 for the Class of 2022.

  Graduates FTLT BPR Placement FTLT JDA
Class of 2012 45,751 25,503 55.7% 4,218
Class of 2013 46,112 25,787 55.9% 4,550
Class of 2014 43,195 25,348 58.7% 4,774
Class of 2015 40,205 23,895 59.4% 4,416
Class of 2016 36,654 22,874 62.4% 3,948
Class of 2017 34,428 23,078 67.0% 3,121
Class of 2018 33,633 23,314 69.3% 3,123
Class of 2019 33,462 24,409 72.9% 2,799
Class of 2020 33,926 24,006 70.8% 2,514
Class of 2021 35,310 26,423 74.8% 3,056
Class of 2022 35,638 27,607 77.5% 2,734

Placement is very good. There was an increase of over 1000 full-time, long-term bar passage-required jobs year-over-year, and the graduating class size was the largest since 2016. It yielded a placement of 77.5%. J.D. advantage jobs decreased somewhat, perhaps consistent with a hot law firm market last year.

It’s remarkable to compare the placement rates from the Class of 2012 to the present, from 56% to 78%. And it’s largely attributable to the decline in class size.

Here’s some comparison of the year-over-year categories.

FTLT Class of 2021 Class of 2022 Net Delta
Solo 234 160 -74 -31.6%
2-10 5,205 5,070 -135 -2.6%
11-25 2,004 2,115 111 5.5%
26-50 1,218 1,360 142 11.7%
51-100 1,003 1,175 172 17.1%
101-205 1,143 1,246 103 9.0%
251-500 1,108 1,145 37 3.3%
501+ 5,740 6,137 397 6.9%
Business/Industry 3,070 2,797 -273 -8.9%
Government 3,492 3,591 99 2.8%
Public Interest 2,573 2,875 302 11.7%
Federal Clerk 1,189 1,130 -59 -5.0%
State Clerk 2,094 2,053 -41 -2.0%
Academia/Education 328 375 47 14.3%

The trend continues last years uptick in public interest placement, which is not an outlier. Public interest job placement is up over 100% since the Class of 2017. These eye-popping number continue to rise. It is likely not an understatement to say that law students are increasingly oriented toward public interest, and that there are ample funding opportunities in public interest work to sustain these graduates. (I include a visualization of the trend of raw placement into these jobs here.)

Sole practitioners continue to slide significantly (they were in the low 300s not long ago in raw placement).

Additionally, extremely large law firm placement continues to boom. Placement is up more than thousands graduates in the last several years. Placement in firms with at least 101 attorneys is around 8500. Nearly 25% of all law school graduates landed in a “Big Law” firm, and more than 30% of those who were employed in a full-time, long-term, bar passage-required job landed in a “Big Law” firm.

Federal clerkship placement has dropped a bit, perhaps because more judges are hiring those with work experience rather than recent graduates, or perhaps because the pool of potential candidates is shrinking as more judges hire students for multiple clerkships.

Prior clerkship experience of Supreme Court clerks has changed dramatically in the last 10 and 20 years

David Lat’s tireless efforts to chronicle the hiring of Supreme Court clerks prompted me to look at a trend that’s developed in recent years. It increasingly appears that multiple clerkships are a prerequisite to securing a Supreme Court clerkship. So I looked at the data for this October Term 2023 class, along with comparisons to the credentials of the OT2013 and OT2003 classes. The results were pretty dramatic. (I looked only at the 36 clerks of the active justices, and the 35 when Chief Justice Rehnquist served on the Court and only hired three clerks instead of the usual four.)

For OT2003, just twenty years ago, 33 clerks came off of one previous court of appeals clerkship, and just two others had multiple clerkships (one of which was not on the federal court of appeals). In 2013, the number off a single prior court of appeals clerkship had dropped to 25. Another nine had two prior clerkships (one of which was not court of appeals), and two more had newer development of two separate court of appeals clerkships. Today, for October Term 2023, just seven of the 36 clerks came from one prior court of appeals clerkship. Fourteen had two prior clerkships, at least one of which was not on the federal court of appeals. And 11 had two prior court of appeals clerkships, and four with the novel development of three prior clerkships.

I’ve lamented that the hoops to jump through for a law school teaching position often involve a series of short-term stints and moves over a course of a few short years. Likewise, I’m not sure this is a particularly welcome development. Admittedly, Supreme Court clerks are a fraction of career outcomes. But many more, I think, are likewise chasing similar credentials of serial clerkships even if they do not get a Supreme Court clerkship in the end. I am not sure that it redounds to the benefit of law students, who as fourth or fifth year associates have much higher billing rates and expectations, but much less practical experience in the actual practice of law. For judges, I am sure that clerks with experience are beneficial, but in previous eras that role may have been given to a career clerk. I don’t know what the longer-term ramifications are, but it’s a trend I’m watching.

February 2022 MBE bar scores fall, match record lows

What had been a record low in February 2020, after a record low in February 2018, after a record low in February 2017, we see a match of the February 2022 score. The mean score was 132.6, down from 134.0 last year and matching the February 2020 low. (That’s off from the recent 2011 high of 138.6.) We would expect bar exam passing rates to drop in most jurisdictions (although results have been decidedly mixed, with wild swings depending on the jurisdiction—big improvements in Iowa and North Dakota, for instance, and a big decline in Oklahoma).

Given how small the February pool is in relation to the July pool, it's hard to draw too many conclusions from the February test-taker pool. The February cohort is historically much weaker than the July cohort, in part because it includes so many who failed in July and retook in February. The NCBE reports that more than two-thirds of test-takers were repeaters. There were significantly more repeaters than February 2021 (unsurprising given 2020 pushed many first-timers to February). Comparisons to February 2020 seem better, then.

As interest in law schools appears to be waning, law schools will need to ensure that class quality remains strong and that they find adequate interventions to assist at-risk student populations.

Law school 1L JD enrollment climbs to 9-year high as non-JD enrollment dips slightly

The 2020 law school enrollment figures have been released. They show the best first-year JD enrollment in a long time and a bit of a drop in non-JD enrollment. About 15% of law school enrollees are not enrolled in a JD program.

For the last seven years, 1L JD enrollment has been between 37,000 and 38,500, remarkable consistency. This year, it’s up to 41,710. That’s the biggest class since 2012-2013, which had an incoming class of 44,481. increase in the quality and quantity of applicants surely fueled the growth.

Total JD enrollment also increased slightly to 117,501, the highest figure since 119,775 in 2014-2015 (but still well off the peak of 2010-2011 with 147,525).

But non-JD enrollment is a different story. For the first time in a long time, non-JD enrollment declined. Last year, I thought pandemic-related travel restrictions coupled with some Department of Education regulations might have dampened the market for at least some foreign-educated non-JD enrollment. It might be that it’s catching up to some schools.

The ABA changed its definitions a few years ago, which resulted in a spike in reported non-JD enrollment, and despite the decline this year overall enrollment remains strong. (It’s also worth noting that those enrolled in both JD and non-JD programs simultaneously, at least in recent years, are counted in each set, so this slightly overstates, to an unknown degree, non-JD enrollment.)

21,044 were enrolled in non-JD programs, a drop of around 250 students over last year. It’s now about 15% of all law school enrollment.

Here I also highlight a handful of schools with the highest non-JD enrollment as a percentage of total law school enrollment. There are a few heavy-hitters that are driving a lot of the non-JD enrollment.

Ranking the most liberal and conservative law firms among the top 140, 2021 edition

One of my most popular posts remains “Ranking the most liberal and conservative law firms.” That post is from 2013, and an update is long overdue.

At the outset, “ranking” a firm or calling it “conservative” or “liberal” is imperfect, I know, but I picked a title eight years ago and I’m sticking with it…. Better to call it, “which law firms contribute the most to Democrats or Republicans.” But I am updating the methodology, and I look forward to doing some even more interesting things with the data in the short term.

First, I looked at 140 law firms. I broke them out into two groups. The first are the AmLaw 100. The second are a group of 40 firms that fit the NLJ500 or Legal 500 plaintiffs’ firms. (Two firms appear in both lists, Paul Weiss and Quinn Emanuel.)

Second, unlike my 2013 ranking (where I looked at contributions to Barack Obama’s or Mitt Romney’s presidential campaigns), I expanded the window. This time, I focused on contributions to the Joe Biden campaign (including “victory fund) and the Donald Trump campaign (including “victory fund” and “Make America Great Again Committee”); the major party organizations (DCCC, DSCC, DNC, NRCC, NRSC, and RNC); and two major aggregators of campaign contributions, ActBlue (Democratic) and WinRed (Republican). There’s a little asymmetry here—Trump had four years of campaigning to Biden’s shorter window, ActBlue is more established than WinRed, etc.—but I think it evens out. These accounted for about 1/3 of all campaign contributions. (Future research will look at more.) I looked at the 2017-2020 period, a four-year window.

Third, I did not look at just attorney contributions, but I looked at any contributions from those employed by these firms. (See update below.) There are often different titles for attorneys (partner, counsel, summer associate, etc.) that are self-reported and are tougher to capture. And I thought it would be useful to include all contributions, even from consultants, paralegals, administrative assistants, and others employed by the firm for a broader portrait of the firm. Again, a judgment call here. I also looked for common misspellings, abbreviations, or alternative names for the firm (e.g., separating out the two Steptoe & Johnsons, etc.) to capture the most contributions.

So, that said, I’m sure there are errors in the data, but it’s a fairly good snapshot.

All told, I captured about $61 million in contributions to Democratic-affiliated groups compared to about $11 million for Republican-affiliated groups in 2017-2020, nearly a 6-to-1 ratio. (See update below.)

Below is a visualization of the AmLaw100 law firms. (By “percentage of contributions,” I mean by dollar figures, not individual instances.)

Many firms had fewer than 10% of contributions go to major Republican outlets. A handful had at least 25%, and just three crossed 50%. Even among those the figures are deceptive. At White & Case, for instance, there was a single $500,000 contribution to the Trump Victory Fund, more than half of all Republican contributions in this four-year time period.

The 40 plaintiffs’ firms results are below (asterisks denote the second listing):

Nine of these firms had $0 in contributions to major Republican outlets in this four-year period; another 6 had less than $100. And while some firms’ contributions were relatively modest (Bernstein, for instance, logged less than $1000 in total giving to these outlets, another deceptive way of looking at this data), others had contributions in the high six figures. Two firms, however, skewed toward Republicans.

Among the ten firms that gave the most money in raw dollars to Democratic outlets (see update below):

Paul Weiss $2,084,171

Latham $1,877,357

Kirkland $1,820,246

Covington $1,794,277

Sullivan & Cromwell $1,579,112

Wilmer $1,424,903

Sidley $1,416,481

Morgan Lewis $1,352,160

Skadden $1,310,634

Boies Schiller $1,080,094

And among the ten firms that gave the most money in raw dollars to Republican outlets (note, of course, duplicates among the largest law firms, and the caveat for White & Case!):

White & Case $966,401

Kirkland $822,685

Proskauer $697,230

Gibson Dunn $468,283

McGuireWoods $383,280

Paul Weiss $353,148

Akin Gump $343,102

Womble Bond $330,725

Holland & Knight $297,266

Kasowitz Benson $291,990

Below is a table with all 138 firms (excluding the pair of duplicate listings), sorted by percentage of contributions to Democratic outlets. As I mentioned, there’s more to come in the months ahead—this is my first cut at many ways of slicing this data.

Firm D R D%
Berger Montague $563,692 $0 100.0%
Grant & Eisenhoffer $379,781 $0 100.0%
Kaplan Fox $77,572 $0 100.0%
Hagens Berman $71,775 $0 100.0%
Hausfeld $35,142 $0 100.0%
Berman Tabacco $21,182 $0 100.0%
Joseph Saveri Law $6,284 $0 100.0%
MoginRubin LLP $5,231 $0 100.0%
Bernstein Liebhard $635 $0 100.0%
Lief Cabraser $764,357 $30 100.0%
Herman, Herman $284,946 $15 100.0%
Bernstein Litowitz $205,015 $15 100.0%
Simons Hanley Conroy $424,296 $50 100.0%
Baron & Budd $472,147 $95 100.0%
Kessler Topaz $200,699 $55 100.0%
Cohen Milstein $294,106 $135 100.0%
Susman Godfrey $489,486 $500 99.9%
Seeger Weiss $131,268 $230 99.8%
Boies Schiller $1,080,094 $2,045 99.8%
Burg Simpson Eldredge $103,696 $262 99.7%
Fenwick $849,559 $2,970 99.7%
Seledny & Gay $68,150 $305 99.6%
Levin Papantonio $32,177 $151 99.5%
Beasley, Allen, Crow $123,253 $585 99.5%
Zelle $28,104 $162 99.4%
Labaton Sucharow $82,877 $546 99.3%
Kramer Levin $384,389 $2,845 99.3%
O'Melveny $948,486 $8,382 99.1%
Perkins Coie $964,601 $10,769 98.9%
Dicello Levitt $8,632 $100 98.9%
Morgan & Morgan $290,895 $3,555 98.8%
Shearman & Stearling $332,843 $5,047 98.5%
Pomerantz $19,756 $300 98.5%
Weitz Luxenberg $139,621 $2,245 98.4%
Schulte Roth $361,008 $6,081 98.3%
Debevoise $688,869 $11,802 98.3%
Covington $1,794,277 $33,529 98.2%
Robbins Geller $220,058 $4,157 98.1%
Reed Smith $536,807 $10,284 98.1%
Cleary Gottlieb $715,532 $15,909 97.8%
Jenner & Block $456,977 $11,051 97.6%
Crowell & Moring $448,249 $10,893 97.6%
Arnold & Porter $1,010,582 $27,555 97.3%
Morrison & Foerster $686,565 $20,164 97.1%
Gibbs Bruns $34,679 $1,200 96.7%
Goodwin Procter $633,974 $22,821 96.5%
McDermott $645,730 $24,701 96.3%
Fried Frank $343,140 $13,632 96.2%
Motley Rice $204,325 $8,147 96.2%
Orrick $512,834 $21,077 96.1%
Wachtell $781,376 $33,328 95.9%
Squire Patton $452,120 $19,432 95.9%
Milbank $226,005 $9,768 95.9%
Ballard Spahr $466,882 $20,190 95.9%
Napoli Shkolnik $14,702 $706 95.4%
Willkie $382,835 $19,520 95.1%
Robins Kaplan $119,526 $6,498 94.8%
Cooley $666,688 $36,707 94.8%
Skadden $1,310,634 $80,853 94.2%
Jackson Lewis $168,690 $11,035 93.9%
Morgan Lewis $1,352,160 $88,704 93.8%
Wilson Sonsini $419,257 $28,105 93.7%
Mintz Levin $161,211 $10,974 93.6%
Davis Wright $400,839 $27,564 93.6%
Latham $1,877,357 $135,776 93.3%
Wilmer $1,424,903 $104,317 93.2%
MoloLamken $22,682 $1,687 93.1%
Weil $304,943 $22,734 93.1%
Loeb & Loeb $253,448 $19,305 92.9%
Venable $515,986 $40,034 92.8%
DLA Piper $1,023,423 $80,517 92.7%
Fragomen $147,320 $11,746 92.6%
Cahill $260,935 $24,916 91.3%
Ropes & Gray $524,768 $51,262 91.1%
Bryan Cave $466,366 $48,313 90.6%
Kilpatrick Townsend $188,884 $19,787 90.5%
Simpson Thacher $531,328 $55,795 90.5%
Faegre Drinker $165,891 $17,446 90.5%
Troutman Pepper $411,574 $43,744 90.4%
Cozen O'Connor $450,877 $50,052 90.0%
Blank Rome $419,866 $47,306 89.9%
Haynes and Boone $187,019 $21,364 89.7%
Paul Hastings $651,679 $80,412 89.0%
Seyfarth $316,918 $41,631 88.4%
Steptoe $444,029 $58,651 88.3%
Sidley $1,416,481 $188,789 88.2%
Sullivan & Cromwell $1,579,112 $213,897 88.1%
Dorsey $236,890 $32,327 88.0%
Quinn Emanuel $706,382 $104,250 87.1%
Hogan Lovells $720,025 $110,101 86.7%
Nixon Peabody $279,456 $42,747 86.7%
Norton Rose $240,355 $36,880 86.7%
Paul Weiss $2,084,171 $353,148 85.5%
McKool Smith $95,052 $16,652 85.1%
Nelson Mullins $317,407 $57,335 84.7%
Cadwalader $147,453 $26,716 84.7%
Olgetree Deakins $156,117 $29,215 84.2%
Greenberg Traurig $774,034 $144,995 84.2%
Baker McKenzie $278,722 $57,845 82.8%
Polsinelli $194,899 $40,510 82.8%
Jones Day $825,506 $180,284 82.1%
King & Spalding $831,622 $182,858 82.0%
Duane Morris $351,147 $81,164 81.2%
Littler $283,479 $66,001 81.1%
Fox Rothschild $207,568 $48,615 81.0%
Davis Polk $580,987 $144,977 80.0%
Katten $235,807 $59,367 79.9%
Mayer Brown $584,028 $149,546 79.6%
Sheppard Mullin $292,187 $76,171 79.3%
Locke Lord $131,402 $37,901 77.6%
Lewis Brisbois $149,093 $44,052 77.2%
Cravath $347,924 $103,555 77.1%
Pillsbury $321,200 $99,733 76.3%
Akin Gump $1,064,087 $343,102 75.6%
Dechert $359,039 $118,551 75.2%
Baker Botts $203,823 $67,908 75.0%
Akerman $336,528 $116,927 74.2%
Husch Blackwell $169,494 $60,715 73.6%
Foley & Lardner $224,329 $82,964 73.0%
Winston & Strawn $575,472 $242,797 70.3%
Kirkland $1,820,246 $822,685 68.9%
Vinson & Elkins $213,491 $97,663 68.6%
Alston & Bird $22,338 $10,362 68.3%
Baker Donelson $169,876 $80,649 67.8%
Gibson Dunn $933,762 $468,283 66.6%
Baker & Hostetler $187,262 $105,942 63.9%
Gordon Rees $89,923 $51,160 63.7%
Holland & Knight $467,830 $297,266 61.1%
K&L Gates $387,345 $254,137 60.4%
Fish $122,748 $85,136 59.0%
Womble Bond $408,260 $330,725 55.2%
Hunton Andrews $170,952 $143,421 54.4%
Barnes & Thornburg $219,289 $189,661 53.6%
McGuireWoods $295,863 $383,280 43.6%
Proskauer $417,600 $697,230 37.5%
White & Case $493,656 $966,401 33.8%
Kasowitz Benson $129,835 $291,990 30.8%
The Lanier Law Firm $51,399 $269,337 16.0%

UPDATE 11/8: Some have asked about whether it makes sense to include all contributors, regardless of job title, into this framework. As I mentioned, attorneys use a variety of titles, and others are ambiguous (e.g., “consultant”). I ran tests at a few of the larger law firms, and I looked at only those who unambiguously identified themselves in some attorney capacity. At these firms, they are 97.5% to 98% of the dollars given. It does not strike me that at many firms—if any—it would materially change the allocation if I did another refinement to include only those who unambiguously identified themselves in some attorney capacity.

UPDATE 11/11: Due to a data entry error, some Perkins Coie contributions were double-counted, which led to an inflated count. The data has been corrected.

Some data on law school-specific debt load disparities between men and women

The ever-valuable LSSSE data recently noted that women tend to graduate from law school with higher debt loads than men. The ABA has tracked this, too. On the heels of recent Department of Education data disclosures, however, we can drill down on law school-specific figures.

I looked at mean debt data for males and non-males. (That’s how the DOE codes the data—I assume the vast majority of non-males are females, but it could include non-binary individuals, and I’ll formally use the DOE coding.) Unsurprisingly (given the aggregate figures from LSSSE & ABA, among others), there are more schools where the mean debt loads for non-males are greater than the mean debt loads for males. At about half the schools, the debt ratios are close to parity—of the 208 schools in my data set, about 100 have a mean debt load of less than a $5000 difference between the sexes.

But I found 72 schools where average debt incurred was at least $5000 more among non-males than males. That gap was at least $10,000 at 34 schools. And it was at least $20,000 among four.

On the other side, there were 35 schools where average debt incurred was at least $5000 more among males than non-males. The gap was at least $10,000 at 14 schools, and at least $20,000 at one school.

I looked at schools on mean non-male debt, less mean male debt. A positive figure (+$10,000) means that the average non-male debt was that much larger than male debt. A negative figure (-$5000) means that the average male debt was that much larger than non-male debt.

Below is a table, then a visualization. These are 2018-2019 figures.

School Mean non-male debt less mean male debt
Univ. of Massachusetts-Dartmouth $42,979
Univ. of the District of Columbia $25,457
Widener Univ. $24,442
Western Michigan Univ.-Thomas M. Cooley $20,851
Tulane Univ. of Louisiana $18,508
Pepperdine Univ. $18,209
Barry Univ. $18,017
Mercer Univ. $17,882
Nova Southeastern Univ. $17,881
Saint Louis Univ. $17,587
Washington and Lee Univ. $17,286
Lewis & Clark College $17,245
Univ. of Georgia $16,200
The John Marshall Law School $15,927
Univ. of Akron Main Campus $15,761
Santa Clara Univ. $14,160
Univ. of Richmond $13,590
Northern Kentucky Univ. $13,087
Mississippi College $12,907
Arizona Summit Law School $12,693
Santa Barbara and Ventura Colleges of Law $12,043
Suffolk Univ. $12,000
Univ. of Oklahoma-Norman Campus $11,975
Univ. of Kansas $11,939
Case Western Reserve Univ. $11,852
Univ. of La Verne $11,705
Southern Univ. Law Center $11,593
Campbell Univ. $11,431
Whittier College $10,906
Wake Forest Univ. $10,609
Univ. of Detroit Mercy $10,458
North Carolina Central Univ. $10,227
Univ. of Memphis $10,088
Thomas Jefferson School of Law $10,048
Harvard Univ. $9,671
Univ. of Idaho $9,472
Arizona State Univ.-Tempe $9,329
Samford Univ. $9,257
Seattle Univ. $9,223
Stanford Univ. $9,134
Florida Coastal School of Law $9,116
Mitchell Hamline School of Law $9,114
Univ. of Houston $9,071
The Univ. of Texas at Austin $8,970
Southwestern Law School $8,517
St John's Univ.-New York $8,355
Cornell Univ. $8,213
Touro College $8,136
Univ. of Missouri-Columbia $7,997
Southern Illinois Univ.-Carbondale $7,938
Univ. of Chicago $7,675
St. Mary's Univ. $7,570
Univ. of North Carolina at Chapel Hill $7,440
New England Law-Boston $7,232
Ohio Northern Univ. $6,882
West Virginia Univ. $6,867
Univ. of Illinois at Urbana-Champaign $6,859
The Catholic Univ. of America $6,859
Univ. of South Carolina-Columbia $6,776
Univ. of Baltimore $6,579
Western State College of Law at Argosy Univ. $6,425
Argosy Univ.-Orange County $6,425
Stetson Univ. $6,127
Georgia State Univ. $6,041
Capital Univ. $6,023
Rutgers Univ.-New Brunswick $6,005
Univ. of Maryland, Baltimore $5,959
Yale Univ. $5,666
American Univ. $5,456
Georgetown Univ. $5,390
Concordia Univ.-Portland $5,229
Texas A & M Univ.-College Station $5,119
Univ. of Wyoming $4,994
Pontifical Catholic Univ. of Puerto Rico-Ponce $4,925
New York Univ. $4,850
Univ. of Notre Dame $4,832
Trinity Law School $4,802
Trinity International Univ.-Illinois $4,802
Wayne State Univ. $4,799
Fordham Univ. $4,747
George Washington Univ. $4,736
Golden Gate Univ.-San Francisco $4,609
Univ. of Arkansas at Little Rock $4,545
Texas Tech Univ. $4,425
Univ. of Denver $4,405
Univ. of Utah $4,403
Univ. of Missouri-Kansas City $4,345
Appalachian School of Law $4,001
Univ. of Iowa $3,976
Seton Hall Univ. $3,831
DePaul Univ. $3,825
Albany Law School $3,732
Univ. of Virginia-Main Campus $3,627
Washington Univ. in St Louis $3,569
Univ. of Florida $3,352
Northwestern Univ. $3,326
Gonzaga Univ. $3,324
Emory Univ. $3,273
Charleston School of Law $3,086
Willamette Univ. $2,836
Univ. of Michigan-Ann Arbor $2,793
Univ. of Oregon $2,746
Univ. at Buffalo $2,366
Syracuse Univ. $2,337
Univ. of Arkansas $2,249
Illinois Institute of Technology $2,042
Belmont Univ. $1,987
Texas Southern Univ. $1,680
Washburn Univ. $1,609
Inter American Univ. of Puerto Rico-School of Law $1,426
California Western School of Law $1,411
Ohio State Univ.-Main Campus $1,357
Chapman Univ. $1,341
Univ. of the Pacific $1,001
Univ. of Louisville $988
St. Thomas Univ. $664
Cleveland State Univ. $619
Charlotte School of Law $457
Univ. of Hawaii at Manoa $402
Univ. of North Dakota $284
Brigham Young Univ.-Provo $257
Atlanta's John Marshall Law School $104
Savannah Law School $104
Univ. of Dayton $50
Univ. of Colorado Boulder -$93
Brooklyn Law School -$169
Boston College -$214
Univ. of Toledo -$343
Pace Univ. -$406
Indiana Univ.-Purdue Univ.-Indianapolis -$410
Purdue Univ. Global-Davenport -$417
Purdue Univ. Global -$417
Loyola Marymount Univ. -$700
Hofstra Univ. -$750
Florida State Univ. -$766
Temple Univ. -$809
Univ. of Miami -$1,194
South Texas College of Law Houston -$1,195
Yeshiva Univ. -$1,236
Univ. of Tulsa -$1,309
The Univ. of Tennessee-Knoxville -$1,316
Michigan State Univ.-College of Law -$1,475
Howard Univ. -$1,521
Duquesne Univ. -$1,652
William & Mary -$1,685
Massachusetts School of Law -$1,906
Univ. of California-Davis -$2,086
The Univ. of Alabama -$2,118
Columbia Univ. in the City of New York -$2,226
Univ. of Washington-Seattle Campus -$2,408
Univ. of San Francisco -$2,461
Univ. of New Mexico-Main Campus -$2,618
Duke Univ. -$2,882
Univ. of Kentucky -$3,042
Loyola Univ. Chicago -$3,172
Univ. of New Hampshire-Main Campus -$3,180
Vermont Law School -$3,241
Ave Maria School of Law -$3,298
Quinnipiac Univ. -$3,330
Univ. of Nevada-Las Vegas -$3,412
Univ. of Southern Maine -$3,502
Univ. of California-Berkeley -$3,644
New York Law School -$3,675
Univ. of Nebraska-Lincoln -$3,685
Florida Agricultural and Mechanical Univ. -$3,805
Louisiana State Univ. -$3,869
The Univ. of Montana -$3,982
Northern Illinois Univ. -$4,129
Univ. of Wisconsin-Madison -$4,137
Florida International Univ. -$4,781
Univ. of California-Hastings College of Law -$4,803
Univ. of Pennsylvania -$4,860
Univ. of Arizona -$4,860
Univ. of Connecticut -$5,274
Taft Univ. System -$5,295
Univ. of Cincinnati-Main Campus -$5,311
Drexel Univ. -$5,630
Univ. of St Thomas -$5,638
George Mason Univ. -$5,982
Villanova Univ. -$6,181
Roger Williams Univ. -$6,393
Univ. of Minnesota-Twin Cities -$6,726
Univ. of San Diego -$6,806
Southern Methodist Univ. -$6,873
Boston Univ. -$7,034
Univ. of Mississippi -$7,069
Univ. of California-Los Angeles -$7,678
Univ. of South Dakota -$8,142
Univ. of Southern California -$8,502
Marquette Univ. -$8,537
Creighton Univ. -$8,542
Regent Univ. -$8,954
Pennsylvania State Univ.-Dickinson Law -$9,492
Pennsylvania State Univ.-Main Campus -$9,492
Oklahoma City Univ. -$10,330
Valparaiso Univ. -$10,441
Ohio Northern Univ. -$10,673
Lincoln Memorial Univ. -$11,282
Univ. of Pittsburgh-Pittsburgh Campus -$12,507
Baylor Univ. -$13,041
CUNY School of Law -$13,275
Indiana Univ.-Bloomington -$13,515
Loyola Univ. New Orleans -$13,696
Drake Univ. -$13,700
Northeastern Univ. -$15,642
Chapman Univ. -$17,551
Vanderbilt Univ. -$18,237
Univ. of California-Irvine -$23,266