Which law schools are most aggressively pursuing admissions UGPA and LSAT medians?
I’ve long noted that USNWR’s decision to use the medians for admissions distorts how law schools behave. Law schools pursue medians at the expense of higher-caliber students who may fall just below targeted medians.
We can find ways of measuring just how aggressively law schools pursue medians. The gap from the 50th percentile to the 25th percentile of admissions metrics can show a drop-off, but that’s really only part of the story. A school can have some gap in the 50th and 25th percentiles, but it may also have a gap in the 75th and 50th, suggesting some reasonable spread among incoming students. Instead, what interests me is how close the gap is between the 75th and 50th, compared to the gap between the 50th and 25th.
Suppose a law school has incoming LSAT scores of 165, 160, and 155 as the 75th, 50th, and 25th percentiles. (This is distorted somewhat because there are more 155s than 165s, so it’s a reason I’ll use LSAT percentiles below in a moment.) That would suggest some fair distribution among the class. Suppose instead it’s a 163, 160, 153. You’ll see the median is closer to the 75th percentile, but the 25th percentile drops of somewhat. It would be in line with my explanation of some distortion in admissions—school preferring students who may have a lower LSAT but a higher GPA, which distorts the 25th percentile. Now suppose it’s 162, 160, and 150. We see tight compression at the 75th and 50th percentiles, consistent with awarding merit scholarships to aggressively pursue a target median LSAT; and a big drop-off in scores at the tail end of the class.
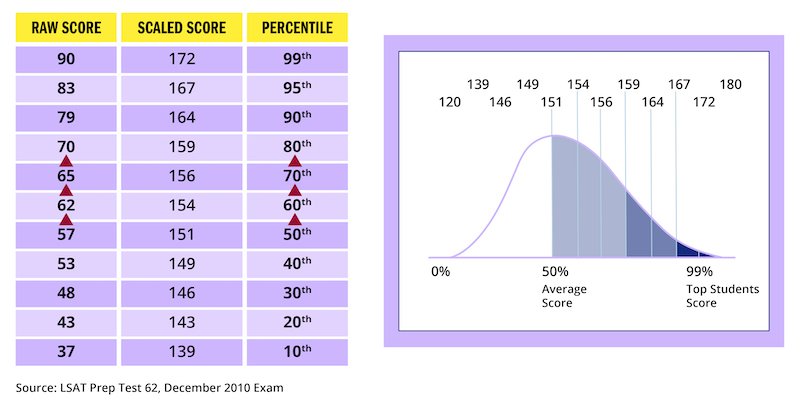
Now, the distribution of LSAT scores is something of a bell curve. The average score is around a 150 on the 120-180 scale. Most scores are clustered in the middle. Fewer and fewer applicants get more and more elite scores. The 155-159 LSAT test score band has around twice as many applicants as the 170-174 band. LSAC application data bears this out. In the 2023 cycle, there were 1661 applicants who had a 155-159 test score. There were 1437 with a 160-164.. That dropps to 1187 for a 165-169. And it’s just 964 with a 170-174, and 365 with a 175-180. This graphic from Kaplan helps show the distribution among scores (a separate way of looking at the data from the applicant profiles):
As I’ve noted elsewhere, a median-chasing strategy is likely to have much lower returns in the future if the new USNWR methodology stays in roughly the same place. Admissions statistics have much lower value. Outputs—including bar passage rate for all of the class, including those students with lower predictors—matter much more. We may see a significant shift in how schools approach admissions. (And that will be an interesting contrast to observe!)
Let’s start with LSAT. The figures below are the difference between the differences of the 75th and 50th percentile LSAT scores and the 50th and 25th percentile LSAT scores (LSAT scores roughly converted to their own percentiles). (I limited this to schools with the top 80 or so overall medians.)
Georgia: 169/168/156, -30.8
St. John’s: 164/162/154, -22.5
Arizona State: 168/167/158, -21.4
Wisconsin: 167/165/157, -19.8
Wayne State: 163/161/154. -19.7
Case Western: 162/160/153, -19.6
Drexel: 161/159/152, -19.4
George Mason: 167/166/158, -19.3
American: 163/162/156, -17.5
Penn State Law: 163/162/156, -17.5
Georgia leads the way—with a 169/168/156, this is really no surprise and maybe one of the more dramatic ones. St. John’s (164/162/154) and Arizona State (168/167/158) are also high on the list.
A few other scores had large numerical LSAT score gaps but were lower on percentile differences. Emory (169/168/ 161, -13.6), Vanderbilt (170/170/163, -12.1), Florida (170/169/162, -12) and Washington University in St. Louis (173/172/164, -10.6) all had gaps of 6 or 7 points in raw scores, but the percentiles of those scores were higher.
I’ll offer a visualization of this one to get a sense of the spread. Note that these LSAT percentiles are approximated, but the LSAT scores are listed to give a sense of the compression of scores near the top of the band.
You can see that these schools have a highly compressed 75th and 50th percentile, and then a large gap to the 25th percentile of the class.
We can also flip the list—which schools have the even distributions (and, for a few schools, closer 50th-25th gaps than 75th-50th)?
Hawaii: 160/156/154, +6.7
Kentucky: 160/157/155, +3.2
Cincinnati: 161/158/156, +2.2
Iowa: 165/163/161, -0.1
Columbia: 175/173/171, -0.3
Texas Tech: 160/157/154, -0.5
Syracuse: 160/157/154, -0.5
Cornell: 174/172/170, -0.5
Loyola-Chicago: 161/159/157, -0.6
Stanford: 176/173/170, -0.9
Schools like Columbia, Cornell, and Stanford are impressive on this front (and Yale is 11th on the list at -1.3) for having such close distributions from the 75th to the 25th, despite how few students have such high LSAT scores.
When we visualize it, we can see how much more evenly distributed the classes are from top to bottom:
You can see the stark contrast among these schools to the schools above.
Over to UGPA:
Washington University in St. Louis: 4.0/3.94/3.43, -0.45
Arizona State: 3.94/3.85/3.42, -0.34
Texas A&M: 3.98/3.93/3.54, -0.34
Wayne State: 3.89/3.8/3.38, -0.33
Florida: 3.97/3.9/3.52, -0.31
Richmond: 3.87/3.75/3.33, -0.3
Drexel: 3.82/3.72/3.33, -0.29
Indiana-Bloomington: 3.92/3.81/3.42, -0.28
George Mason: 3.93/3.83/3.45, -0.28
Chapman: 3.78/3.63/3.2, -0.28
Three schools (Arizona State, Wayne State, and George Mason) make both lists. (As noted, Washington University in St. Louis and the University of Florida have fairly large LSAT spreads, but that did not translate to percentile differences.)
Now on the flip side, most balanced incoming class based on UGPA metrics:
Iowa: 3.83/3.66/3.49, 0
Mississippi: 3.81/3.54/3.27, 0
Stanford: 3.99/3.92/3.84, -0.01
Oregon: 3.76/3.57/3.37, -0.01
Stetson: 3.73/3.51/3.28, -0.01
Columbia: 3.95/3.87/3.78, -0.01
Yale: 3.99/3.94/3.87, -0.02
Berkeley: 3.9/3.83/3.74, -0.02
Cincinnati: 3.91/3.73/3.52, -0.03
Loyola-Chicago: 3.72/3.56/3.37, -0.03
Harvard: 3.99/3.92/3.82, -0.03
Duke: 3.84/3.85/3.73, -0.03
We see some of the same schools (Cincinnati, Columbia, Iowa, Loyola-Chicago) make both lists here, too.
It’s pretty stark to see some of the disparities in the gaps of how UGPA percentiles fill out a class. Washington University (4.0/3.94/3.43) has a higher 50th percentile than Iowa’s (3.83/3.66/3.49) 75th percentile, but it has a lower 25th percentile.
Recall, the metric here is not about the “best” or “worst” schools. It’s meant simply to display the disparities in how schools treat the delta between the 75th and 50th percentiles, and the 50th and 25th percentiles, in their incoming classes.
There’s no question that schools have widely divergent approaches to “chasing” the median. Some schools are much more aggressive, on one or both metrics, than others. And others are much more aggressive about ensuring “balance” in the class—it’s doubtful that schools with fairly “balanced” classes on both metrics get there by accident. Those more balanced classes (especially on the LSAT metric) are more likely (contingent on many other factors) to see more long-term success on the bar exam, relatively speaking. But there are many other factors at play that complicate this. And many other factors that could affect matters like academic dismissals, scholarship retention, employment outcomes, and the like.
It will be illuminating to see if the median “chasing” diminishes in light of new rankings metrics. But it’s certainly something I’m watching.